Overview
Within this project, the study of tuna was restricted to wild catch. This removes the environmental impacts associated with the growing stage, and causes the processing and distribution stages to become the primary area of focus.
The United Nations Food and Agriculture Organization (FAO)'s database, FishStatJ, provides insight into the wild-caught tuna market. In 2018, about 51% of global tuna products were transported through Asia. The next largest quantities are 17% occurring in Europe, and another 16% in the Americas.
The same dataset also shows that in 2018, about 58% of global tuna products were transported frozen, 40% were preserved, and the remaining 2% were chilled or live. This demonstrates the extent to which refrigeration during transport contributes to the fuel use intensity of tuna products, as well as the importance of tuna processing plants.
Data Collection
This project compiles data from ten individual life cycle assessment (LCA) studies of the tuna industry, with each study taking into account similar stages of fishing, processing, packaging, and distribution. All data was standardized using a functional unit of one kilogram of edible weight. The lack of LCAs of wild-caught tuna became apparent throughout the process of data collection, as the vast majority of extant research looks solely at GHG emissions. This meant that trends for environmental indicators like acidification and eutrophication potential had to be determined from a small set of data, producing potential room for error.
GHG Emissions
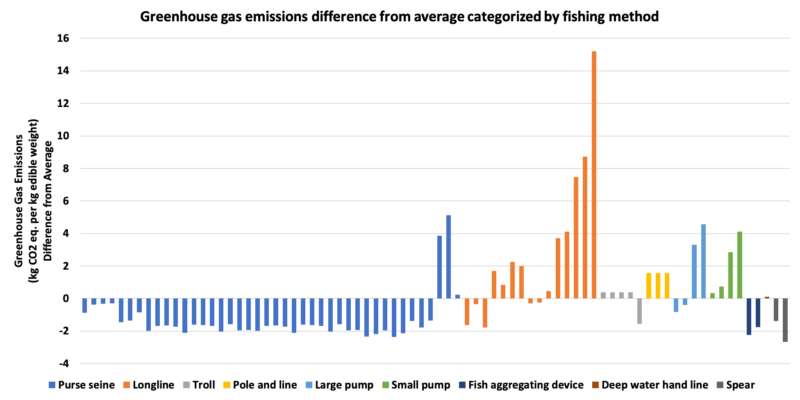
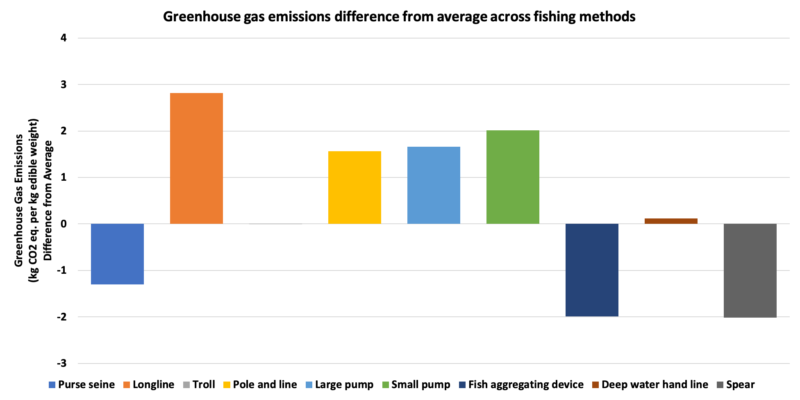
A first set of anomaly graphs was produced to examine the GHG emissions value calculated by various LCAs (Figures 10.1 & 10.2). A negative value indicates that the GHG emissions of that specific data point was lower than the dataset average, while a positive value indicates GHG emissions greater than the average. Figure 10.2 displays the same set of data as Figure 10.1, but all of the values within each fishing method have been averaged.
Figure 10.1. Distribution of GHG emissions difference from average, color coded by fishing method. Data from Avadí et al. (2015), Hillborn et al. (2006), Hospido et al. (2006), Hospido & Tyedmers (2005), Minami et al. (2004), Parker et al. (2014), Poovarodom et al. (2011), Tan & Culaba (2009), Tyedmers & Parker (2012), Wilson & McCoy (2009).
Figure 10.2. GHG emissions difference from average by fishing method for tuna. Data from Avadí et al. (2015), Hillborn et al. (2006), Hospido et al. (2006), Hospido & Tyedmers (2005), Minami et al. (2004), Parker et al. (2014), Poovarodom et al. (2011), Tan & Culaba (2009), Tyedmers & Parker (2012), Wilson & McCoy (2009).
The majority of purse seine fisheries produced lower GHG emissions than the average, while longline fisheries tend to produce more than the average (Figure 10.1). The averages within each fishing method demonstrate clearly that purse seine, fish aggregating device, and spear fisheries appear to be the best performers (Figure 10.2).
This information is particularly fascinating because of the recent prominence of purse seine fisheries in the tuna industry. The International Seafood Sustainability Foundation (ISSF) explains that purse seine fisheries account for about 66% of annual global tuna catch, and typically consume 368 liters of fuel per tonne of tuna landings. In contrast, longline, pole and line, and troll fisheries each consume over 1,000 liters of fuel per tonne of landings. Increased fuel consumption is a primary cause for increased GHG emissions from tuna products.
With such high fuel efficiency for purse seine fisheries in comparison to other ear types, the question arises regarding why other methods of fishing are still used. Purse seine fleets catch relatively inexpensive, young, smaller tuna which can be used in canned tuna products, whereas longline fisheries are responsible for higher quality, larger fish. Although an approach which solely values GHG emissions reduction might favor a complete transition to purse seiners, longline fleets contribute to an entirely separate market for high quality, sushi-grade fish. The case study of purse seine versus longline fisheries provides insight into the complex factors that must be taken into account when seeking sustainable forms of agriculture.
Covariance of Environmental Indicators
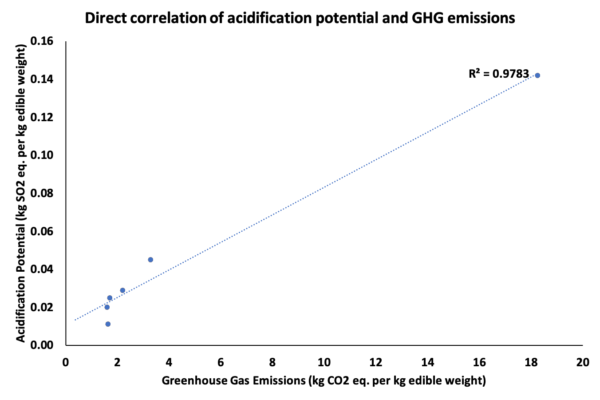
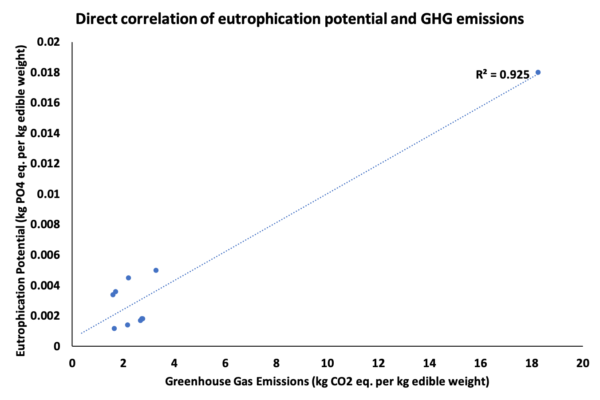
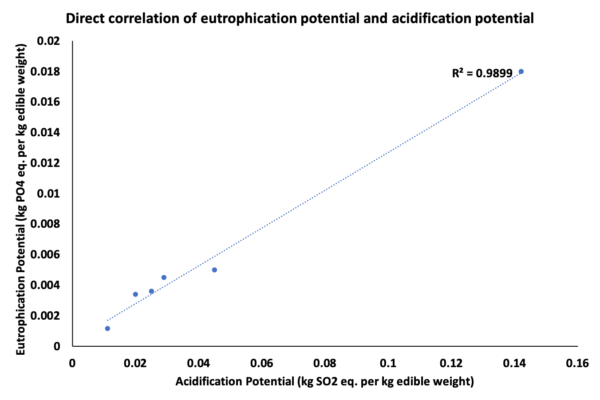
A second set of graphs demonstrates the relationships between GHG emissions, acidification potential, and eutrophication potential (Figures 10.3, 10.4, 10.5). These three graphs include acidification potential versus GHG emissions, eutrophication potential versus GHG emissions, and eutrophication versus acidification potential.
Each of the graphs demonstrates direct or linear correlation, with r2 values greater than 0.9; note that these datasets comprise only a few data points, but these relationships also make sense based on our physical understanding of the system. Fishing and processing methods which seek to decrease one environmental impact would thus be capable of simultaneously decreasing various other emissions.
Within each of these graphs, there is one significant outlier, which represents data from smaller longline fisheries in Japan. This point does follow the same linear trend line demonstrated by the other points, and is therefore included on the graphs.
The linear relationship between the three environmental impacts is logical because GHG emissions, acidification potential, and eutrophication potential all generally arise from similar stages in the tuna supply chain. The transportation of tuna products from fishing vessels to processing plants, as well as from processing plants to consumers, is the primary contributor of fuel use and emissions.
Future Implications
Efforts to ameliorate environmental impacts of the tuna industry should focus on reducing fuel use, through greater fuel efficiency or renewable energy usage. Future research in the field should be done to evaluate emissions patterns across various fishing methods, locations, and product types. The tuna industry is large in magnitude and extremely diverse, and efforts to reduce the environmental impacts of tuna fisheries must embrace this innate diversity, seeking to adopt sustainable practices and make changes based on local needs and abilities.

