Over 70% of global shrimp consumption is attributed to developed countries. Japan, the United States, and Europe lead with the highest rates of per capita consumption. In fact, as the second-most popular seafood in the United States, shrimp tops the list of the nation’s seafood imports along with salmon and tuna, according to a 2018 NOAA report. In 2019 alone, the United States imported 698,358 metric tonnes, or approximately 1 billion pounds, of shrimp.
In comparison to the other nine commodities analyzed in this paper, shrimp aquaculture has high, if not the highest, environmental impacts for freshwater withdrawal, eutrophication potential, and acidification potential. In addition, while the land use required for shrimp production is relatively low, levels of GHG emissions are the second highest of all the commodities, second only to beef. With such high emissions and demand, a more sustainable future for shrimp aquaculture is absolutely necessary.
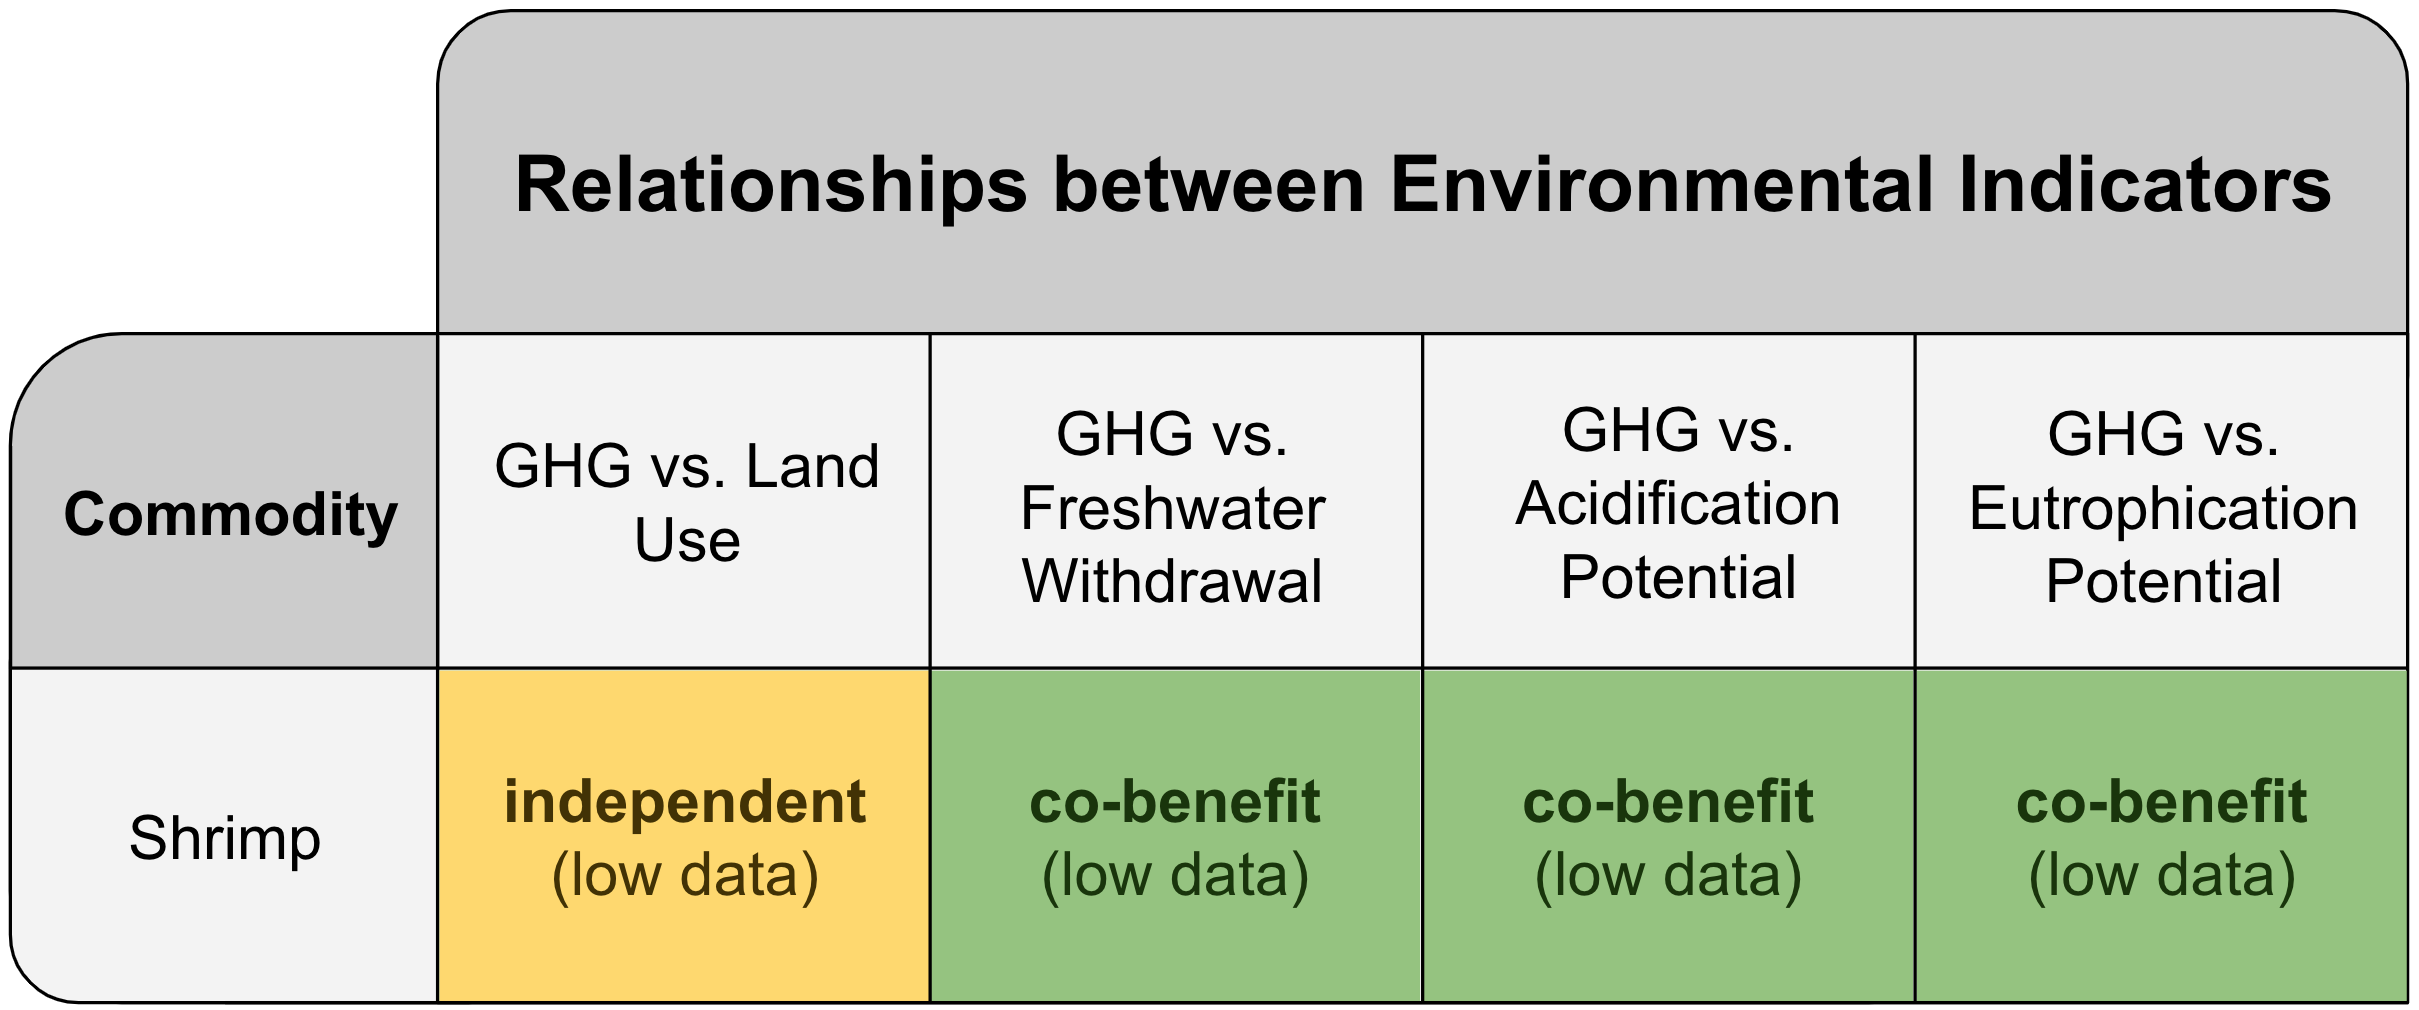
For shrimp aquaculture, there appear to be direct linear relationships between all environmental indicator pairs excluding GHG emissions and land use. Thus, decreasing GHG emissions is unlikely to have trade-offs, and is likely to have environmental co-benefits. Variations in the performance of farms with certain system and water types suggest that cultivating less freshwater shrimp species and increasing intensity of production could lead to lower overall emissions.

