Overview
Over 70% of global shrimp consumption is attributed to developed countries. Japan, the United States, and Europe lead with the highest rates of per capita consumption. However, according to a 2019 report, China and Thailand are the leading producers worldwide, accounting for nearly 3/4 of production. As the demand for these crustaceans is centered in countries with less shrimp production, the product is often exported before reaching consumers.
In fact, as the second-most popular seafood in the United States, shrimp tops the list of the nation’s seafood imports along with salmon and tuna, according to a 2018 NOAA report. In 2019 alone, the United States imported 698,358 metric tonnes, or approximately 1 billion pounds, of shrimp.
This paper analyzes the environmental impacts of shrimp aquaculture, taking into consideration that over the past three decades, shrimp production has shifted almost entirely from wild-caught to farmed, or aquaculture, systems. The analysis encompasses aquaculture farms across Bangladesh, Brazil, China, the Philippines, Thailand, and Vietnam. It includes five species, two freshwater and three marine: Macrobrachium rosenbergii, Macrobrachium amazonicum, Penaeus monodon, Litopenaeus vannamei, and Fenneropenaeus chinensis.
Analysis Methods
The AgImpacts team compiled a total of 22 sample points, each of which represents either a single farm or a group of farms in the same geographical region with similar methods.All data sources are available in the AgImpacts Web Tool. For further analysis, we classified each farm by system type––polyculture, extensive, semi-intensive, or intensive. We defined polyculture systems as farms that produce two or more seafood commodities within the same aquaculture system, then categorized the remaining farms as either extensive, semi-intensive, or intensive depending on their inputs, treatments, and outputs, as defined in the Aquaculture Production Intensity Scale (APIS).
Mangrove ponds are not considered polyculture systems in this analysis. The team chose to exclude data from shrimp ponds built in mangrove forests because the data from such systems were extreme in comparison to that of the polyculture, extensive, semi-intensive, and intensive systems due to the negative environmental impacts of mangrove deforestation and inconsistent estimates of pond methane emissions.
For shrimp specifically, we color-coded the graphs by country, system type, water type, and species. The graphs color-coded by country are displayed below. The functional unit for this data is 1 kilogram of edible weight or retail weight.
Despite the commodity’s popularity, there is significantly less available data on its environmental impacts in comparison to the other nine commodities in this study. Although there is insufficient data to make any statistically significant conclusions, visualizations seem to suggest relationships among the indicators, as well as clear differences in environmental impacts among countries, system types, and species (Figures 9.1, 9.2, 9.3).
Data Analysis
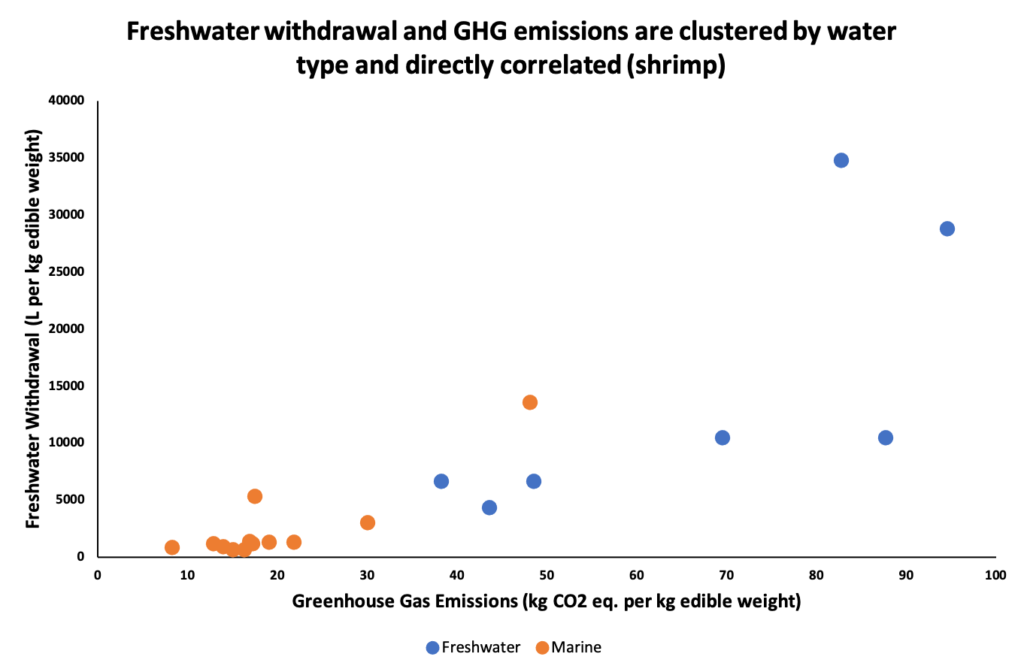
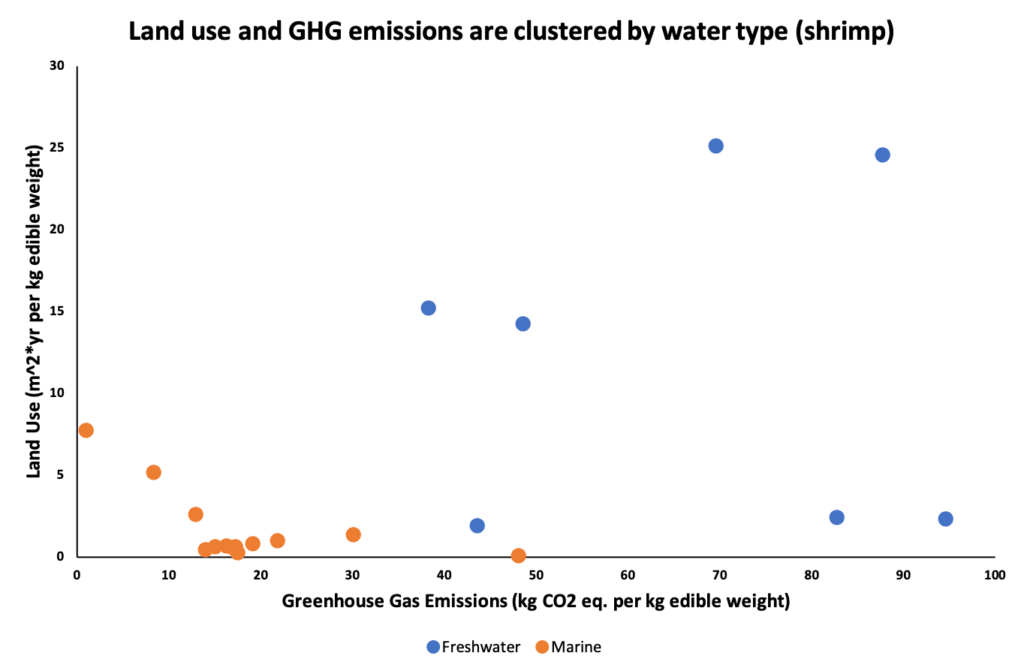
Our analysis suggests direct positive relationships between all indicator pairs aside from GHG emissions and land use (Figure 9.1). In fact, after further analysis, it became clear that all indicators except for land use vary directly with each other. Interestingly, the points that do not lie in a direct linear relationship in the GHG emissions versus land use graph are all from aquaculture farms in Bangladesh. Although the farms in Bangladesh represent the highest GHG emissions, freshwater withdrawal, eutrophication potential, and acidification potential within this dataset, it seems that land use stays relatively low, regardless of the magnitude of other environmental impacts.
However, it is possible that the trend described above is influenced by the system types represented by the farms in Bangladesh: extensive and polyculture. For every pair of impacts, the extensive systems are on the more extreme end of the spectrum, the intensive systems are clumped near the origin, and the semi-intensive and polyculture systems are spread out throughout the range (Figure 9.2). As the data from Bangladesh represents extensive and polyculture farms, it is possible that the independence of land use only stands true for certain system types.
In discussing the relationship of land use to the other four indicators, it is also worthwhile to observe the data from China. The land use data for farms in China appears to be inversely, rather than directly, correlated with the other environmental indicators. Further investigation and data collection would be necessary to determine whether land use is actually independent of the other four key environmental impacts.
Lastly, we analyzed the data based on water type to search for relationships between freshwater and marine systems. The water type of an aquaculture system is typically determined by shrimp species. Of the species included in this project, two are freshwater species (Macrobrachium rosenbergii and Macrobrachium amazonicum) and three are marine species (Penaeus monodon, Litopenaeus vannamei, and Fenneropenaeus chinensis). The freshwater systems consistently showed the most extreme values in all five indicators (Figure 9.3). However, it is necessary to note that the team was unable to find any data on intensive freshwater farms. Therefore, it is unclear whether this trend is related to system types, lower water salinity, available farming technologies in various countries, or a difference in necessary maintenance between freshwater and marine species.
Environmental Impacts in Perspective
In comparison to the other nine commodities analyzed in this paper, shrimp aquaculture has high, if not the highest, environmental impacts for freshwater withdrawal, eutrophication potential, and acidification potential. In addition, while the land use required for shrimp production is relatively low, levels of GHG emissions are the second highest of all the commodities, second only to beef. We also saw the strongest relationships among environmental impacts, suggesting that for shrimp, intensification tends to improve environmental performance.
Indeed, there are physical explanations for these environmental indicators. The disparity between freshwater withdrawal and land use is perhaps the most intuitive, as shrimp aquaculture, by nature, requires less land and more water than crops or livestock. As for GHGs, a significant source of emissions could be due to transportation. However, data from Poore and Nemecek (2018) suggests the farm stage contributes most significantly to overall GHG emissions. This is most likely due to maintenance of the shrimp ponds, which, as detailed in the APIS, could entail lighting, temperature control, effluent processing, or solid waste processing, all of which require energy use. In extensive systems, emissions can come both from land-use change or from emissions of N2O and methane from ponds. Higher levels of eutrophication potential could be due to the aforementioned effluents and solid waste produced by the shrimp. Additional research would be necessary to identify key sources of acidification.
Unlike the commodity analysis for salmon, there was little to no available data on emissions at the feed stage for shrimp aquaculture. Only 6 of the 22 compiled data points include itemized information on feed; by definition, the extensive systems were unfed, creating a large degree of heterogeneity. Considering the APIS criteria for system classification, higher environmental impacts due to feed would be expected for intensive and semi-intensive farms. However, of the 6 data points in question, only 1 represented an intensive system, 3 represented semi-intensive systems, and 2 represented extensive systems. From this distribution, we assumed that the feed stage had negligible impact on our shrimp aquaculture analysis.
Conclusion
Further research is needed before any concrete suggestions can be made regarding methods for improving the negative environmental impacts of the shrimp aquaculture industry as a whole. However, decreasing the cultivation of freshwater shrimp species and increasing the intensity of farms could reduce the environmental impacts of production. Considering the large volume of shrimp imported into Japan, the United States, and Europe annually, future research with more detailed data could involve inspection of environmental impacts from each stage in the supply chain. Moreover, analyses could conduct deeper investigation into the relationship of land use with the remaining indicators, as explained above.
In searching for methods to decrease the environmental impacts of shrimp aquaculture and the broader seafood industry, it is also critical to look beyond the four farming systems analyzed in this project. For example, producing shrimp in innovative polycultural systems such as aquaponics or regenerative ocean agriculture could not only decrease necessary inputs and treatments, but also reduce emissions related to importation. A multifaceted approach of improving existing farming systems while increasing the availability of new methods could significantly lower the negative environmental impacts of shrimp production.


