Overview
Salmon aquaculture, the fastest-growing food production system worldwide, is at a crucial stage where understanding its environmental effects is key. As salmon moves onto more and more people’s plates, a careful eye on responsible production methods is needed in order to curb its environmental footprint. Despite its importance, however, there is a lack of available data on aquaculture systems outside of GHG emissions, which impacts our ability to make conclusions with solid statistical significance.
The AgImpacts team compiled and analyzed data spanning six countries (Australia, Canada, Chile, France, Norway, and the United Kingdom) and six broad system types (floating bag, flow-through, net pen, recirculating, sea cages, and solid wall aquaculture systems).
Detailed records of sources and methodology can be found within the team's full report.
Data Analysis and Overwhelming Influence of Feed in Emissions
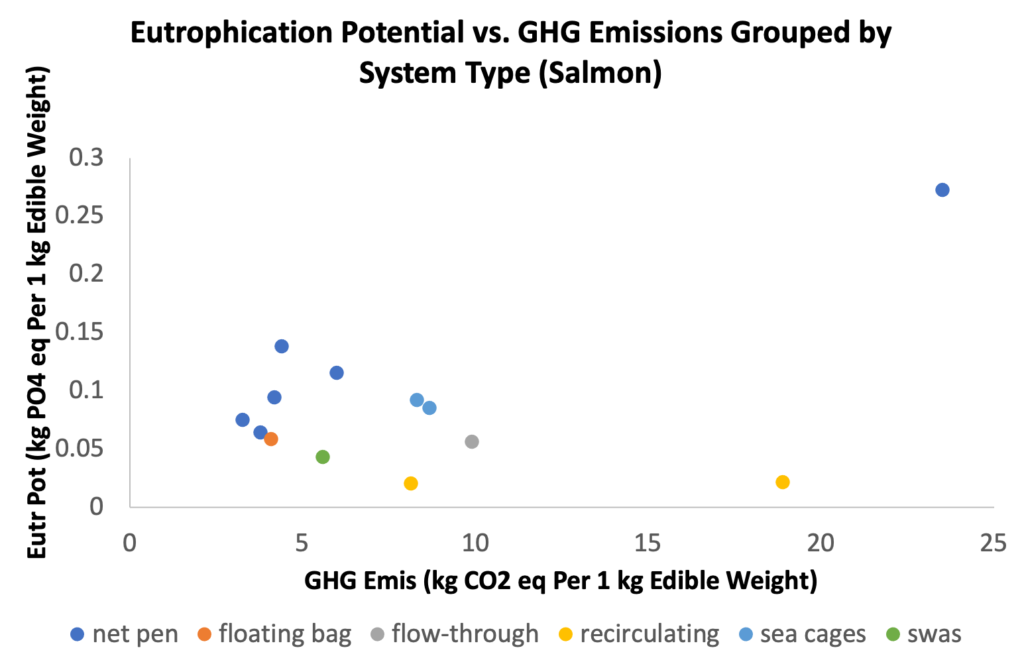
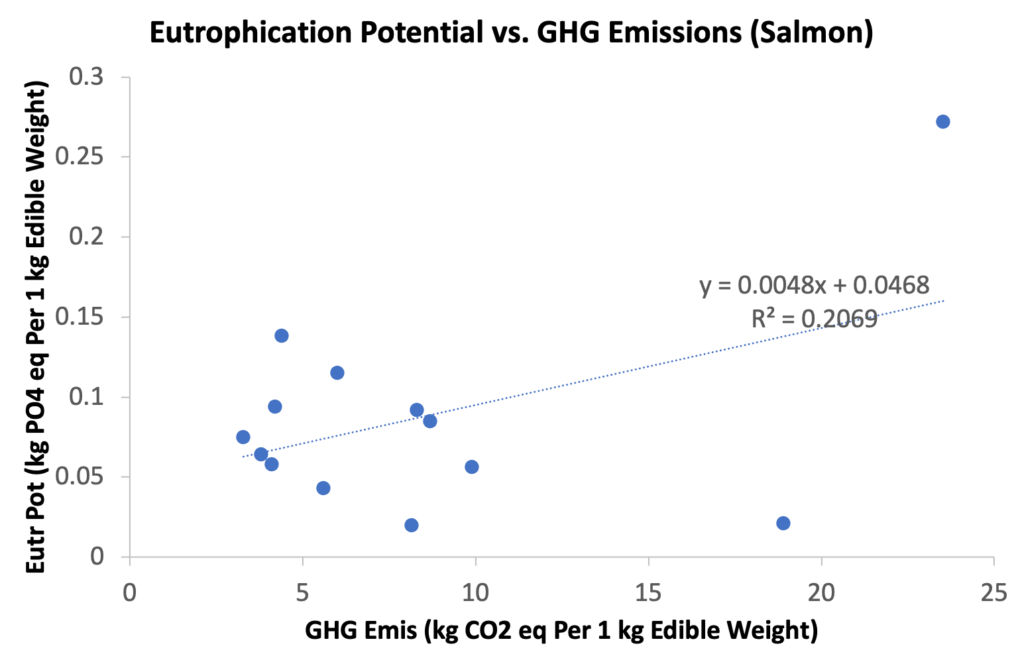
A starting area of interest for us was the eutrophying emissions released by the specific fish farms. At a glance, we hypothesized that there would be a strong correlation between GHG emissions and eutrophication potential, inferring that recirculating systems take more energy but release less organic material freely in the environment compared to open-water cages. However, the two seem to not be correlated at all (Figure 8.1a), yet it is true that recirculating systems produce lower eutrophying emissions than net pen or cage systems (Figure 8.1b).
Figure 8.1. GHG emissions vs eutrophication potential , first clustered by farm type (left) and second with a linear regression on the full dataset (right). Data from Poore and Nemecek (2018), Ayer (2009), Parker (2017), and Pelletier (2009).
A possible reason for the lack of correlation lies in the overwhelmingly large amounts of GHG emissions at the feed stage — dwarfing the variations of the different production systems. Unfortunately, tracing feed impacts is difficult as inputs vary and arrive from a plethora of sources, often by-products of other commodity processing. Emissions factors for minor ingredients are often lacking, and the composition of feed changes rapidly.
A Closer Look Into Salmon Feed Impacts
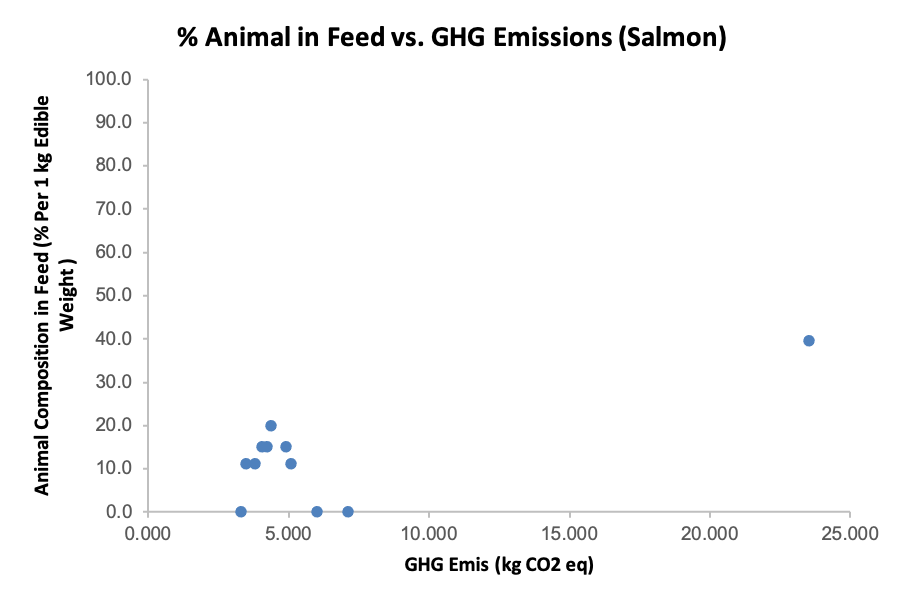
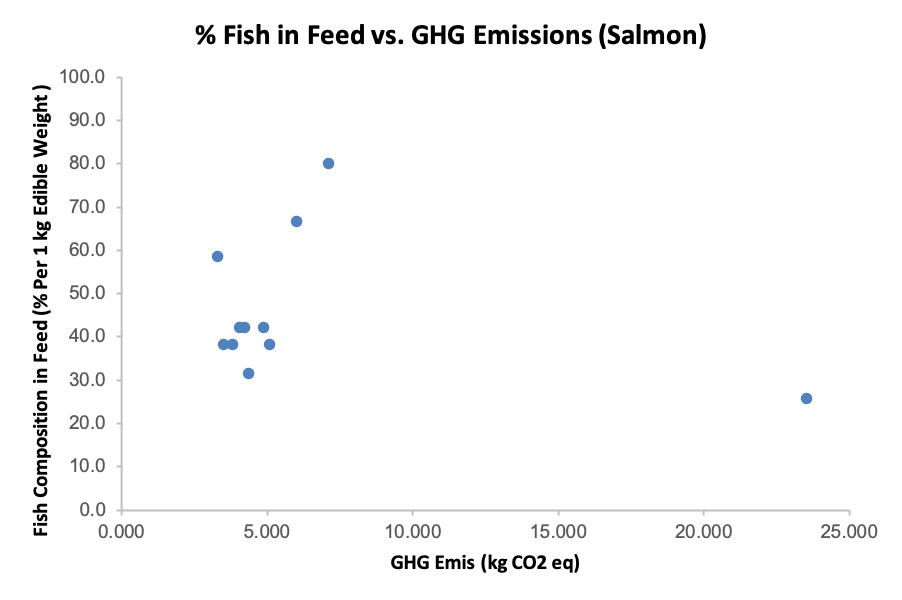
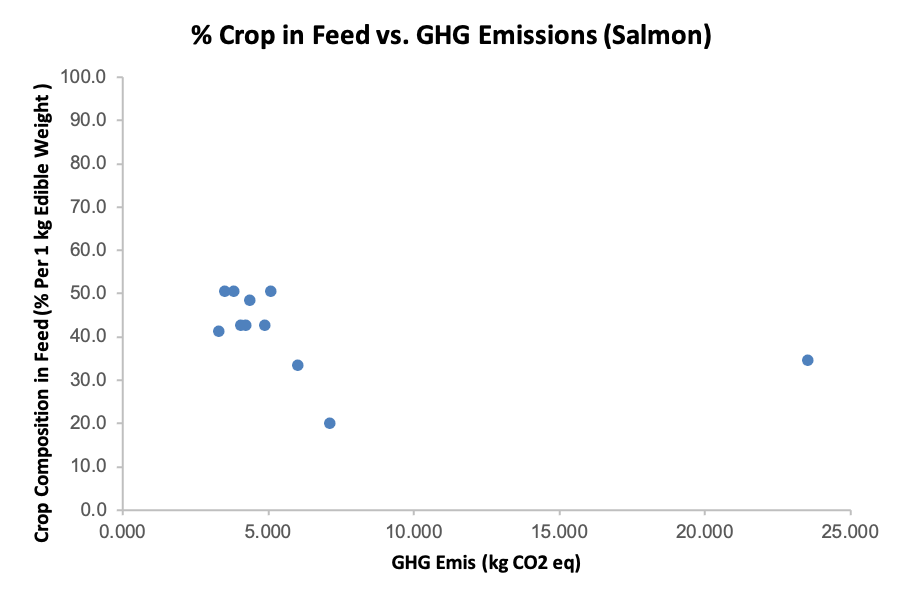
When analyzing feed composition ratios of crop, fish, and (non-fish) animal products against GHG emissions, we find that while total GHG emissions have little correlation with the feed composition (Figure 8.2). While animal source components may have high embedded GHG emissions, other non-animal source components of feed, like soy, may also have relatively high emissions intensity. Note that when different allocation methods are applied, the importance of animal source foods to the total impact may change.
Figure 8.2. GHG Emissions vs various feed composition ratios. Emissions allocated by energy. Data from Parker (2017).
Land Use, Freshwater Withdrawal, and Embedded Impacts
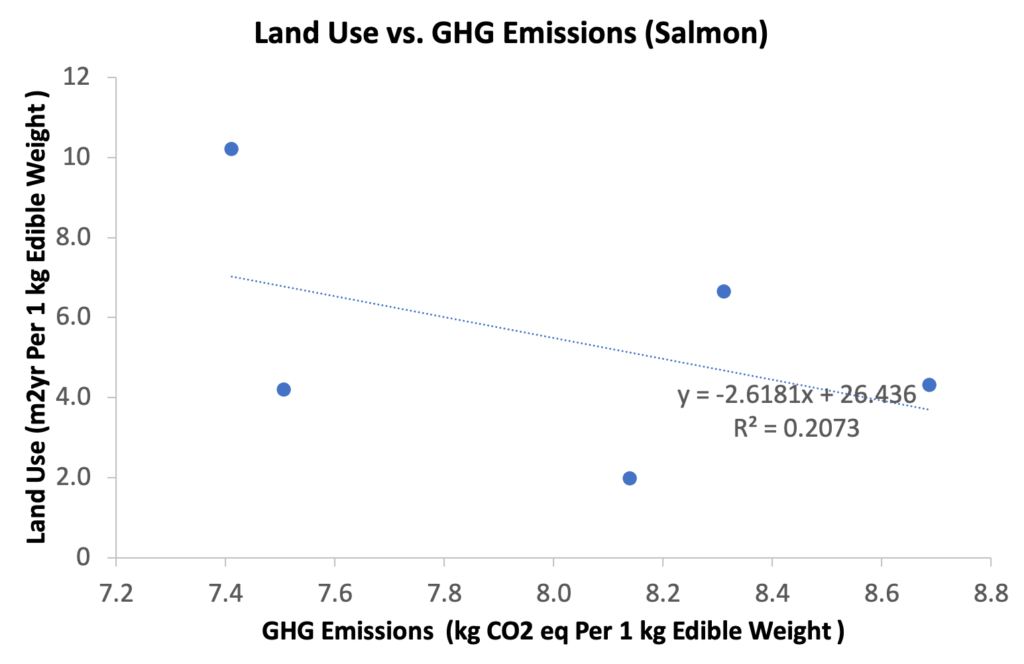
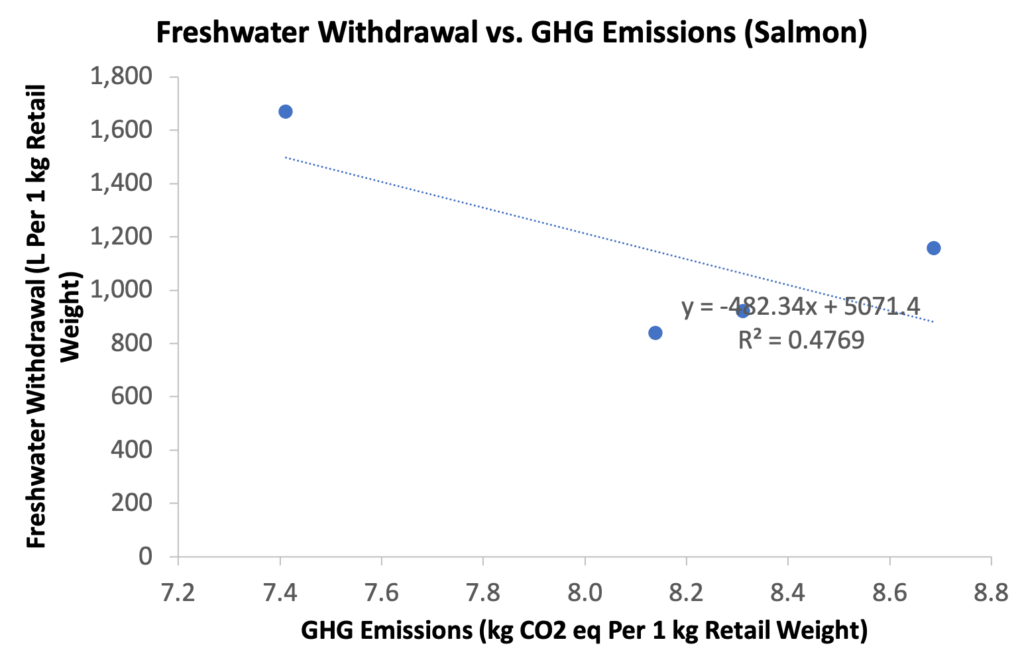
Less data exists on land use and freshwater withdrawal, but with existing points we see a potential inverse relationship (Figure 8.3). However, the points displayed actually fall in an extremely small range of GHG emissions, so further data would be needed before any conclusions can be made.
Figure 8.3. GHG emissions vs land use and freshwater withdrawal. Data from Poore and Nemecek (2018).
Perhaps a more interesting comparison is that of median salmon land use (4.3 m2yr per kg edible weight) against median land use of primary feed ingredients soy (3.6 m2yr per kg edible weight) and maize (2.3 m2yr per kg edible weight). Given the context of the plant commodities’ large land use range, it can be assumed a significantly large amount of the land use in salmon aquaculture is simply inherited through the feed stage; given that salmon have a relatively efficient feed conversion ratio, it makes sense these numbers are similar. In contrast, we find a large difference in values when comparing median salmon freshwater withdrawal (1038 L per kg edible weight) against median freshwater withdrawal of soy (6.1 L per kg edible weight) and maize (0.0 L per kg edible weight), suggesting that freshwater withdrawal arises mostly at the farm stage and is not simply passed on from feed.
It is also important to note that the above observations on land use and freshwater withdrawal may vary based on farm type— the systems represented in Figure 8.3 include only sea cage and recirculating for freshwater withdrawal, with one additional floating bag system in land use. More data is needed to confirm these deductions and move forward with assessing impacts at each part of the salmon life cycle.
Direct Relationship Between GHG Emissions and Acidification Potential
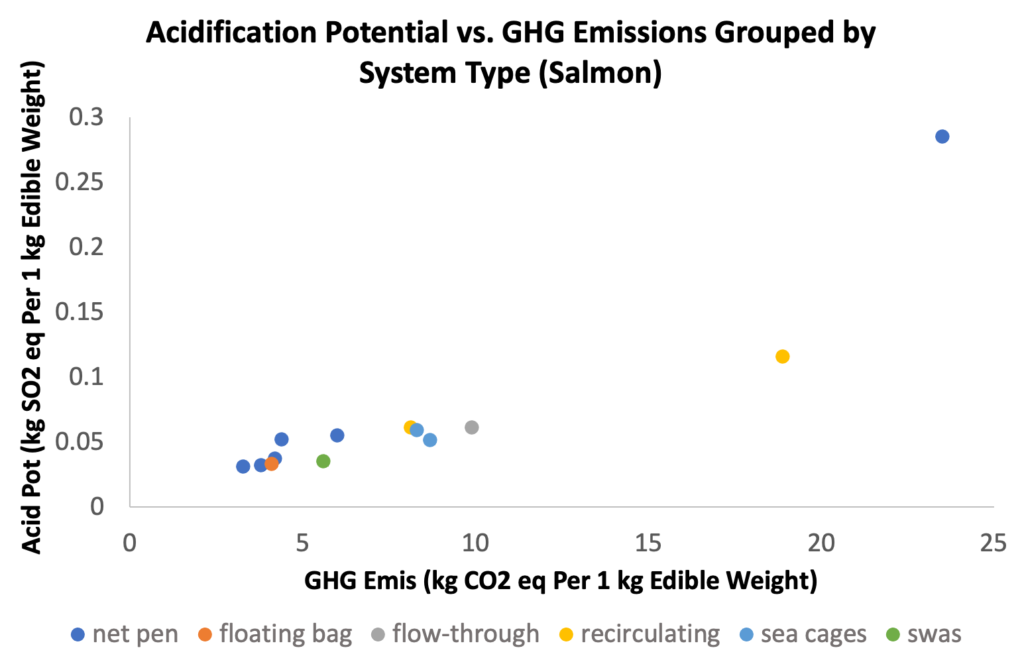
In terms of acidification potential, there is a quite strong direct correlation between acidification potential and GHG emissions while no visual clustering of system types are seen (8.4). Such a relationship is a good indicator that lowering GHG emissions works in tandem with lowering acidification potential.
Figure 8.4. GHG Emis. vs Acid Pot, first clustered by farm type and second with a linear regression on the full dataset. Data from Poore and Nemecek (2018), Ayer (2009), Parker (2017), and Pelletier (2009).
Moving Forward: Next Steps and the Future for Salmon
Overall, points for improvement surface overwhelmingly in the feed stage, especially in the inclusion of animal by-products. However, concerns about waste arise in the efficiency of shifting these compositions as much of salmon feed is made of by-products of other commodities — in the case of animal byproducts, poultry by-product, blood, and hydrolyzed feather meals are commonly used — and thus are already “produced” and ratios often are adjusted based on by-product availability. Further concerns arise as shifting towards a crop-based diet may increase the amount of feed needed, possibly inflating impacts.
Thus, our next steps include looking further into the feasibility of changing feed compositions and more research on salmon feed, as well as further research into the more concerning initial data that suggests a potential inverse relationship of GHG emissions versus land use and freshwater withdrawal. Aggregation of more data points outside of solely GHG emission levels is also high priority in order to allow us to further explore and confirm trends observed.

