Production and consumption
Roundwood is a raw material critical to the availability of paper products, manufactured products such as furniture, and construction materials like particleboard and strandboard. In 2010, global per capita consumption of forestry products had been increasing by one percent each year for the past three decades. As of 2015, planted forests cover 277.9 million hectares globally, a number that is only increasing. Due to the ubiquity and magnitude of this demand, improving industry sustainability is critical.
In 2012 the FAO (Food and Agriculture Organization of the United Nations) found that the top ten producers were Brazil, the USA, China, India, Chile, New Zealand, Australia, South Africa, Thailand, and Indonesia. More recently in 2016, the FAO found that the top five producers of industrial roundwood were the USA, the Russian Federation, China, Canada and Brazil, together accounting for 55% of global production. Due to availability, our dataset currently represents only Europe, South America, and the USA.
Production Systems
Natural systems: natural regeneration, no site preparation, stand establishment or maintenance.
Extensive systems: artificial regeneration through minimal methods such as seed sowing, no fertilization, minimal initial site clearing and pruning.
Intensive systems: artificial regeneration through seedling cultivation and planting, fertilizer application for site preparation and stand maintenance.
Production Stages
Site preparation: site clearing, initial fertilization and herbicide application, etc
Stand establishment and tending: seedling cultivation, planting, pruning, fertilizer, herbicide, and pesticide application, etc
Logging and Hauling: felling, forwarding, transportation to roadside, etc
Infrastructure establishment and maintenance: creating and maintaining roads, building firebreaks, etc
Relationships between environmental indicators
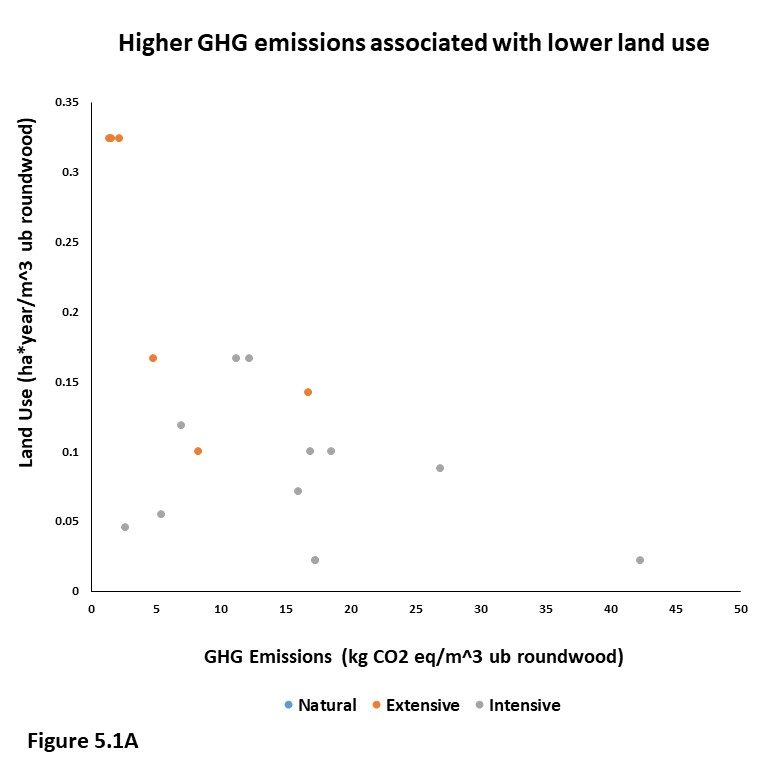
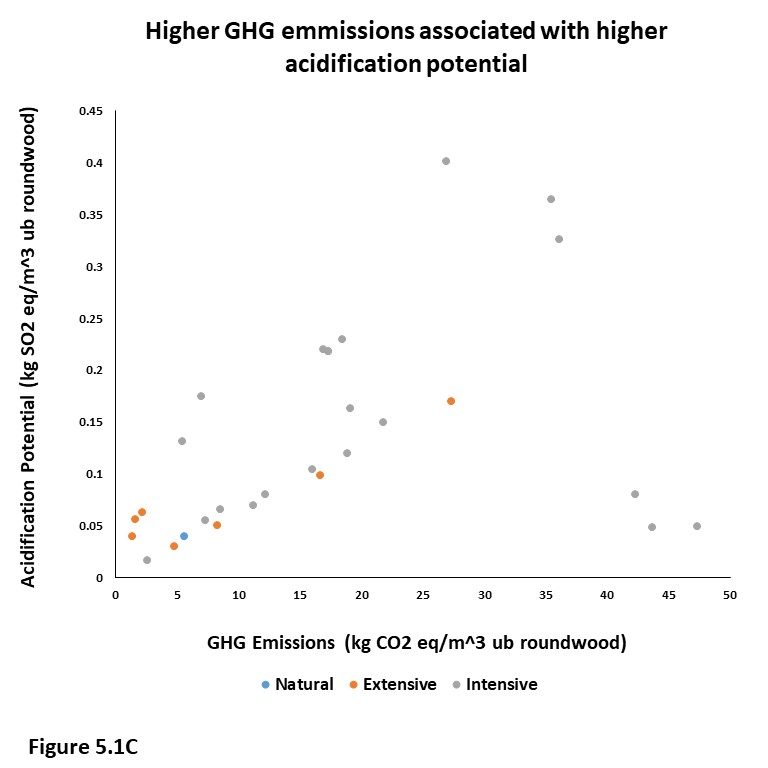
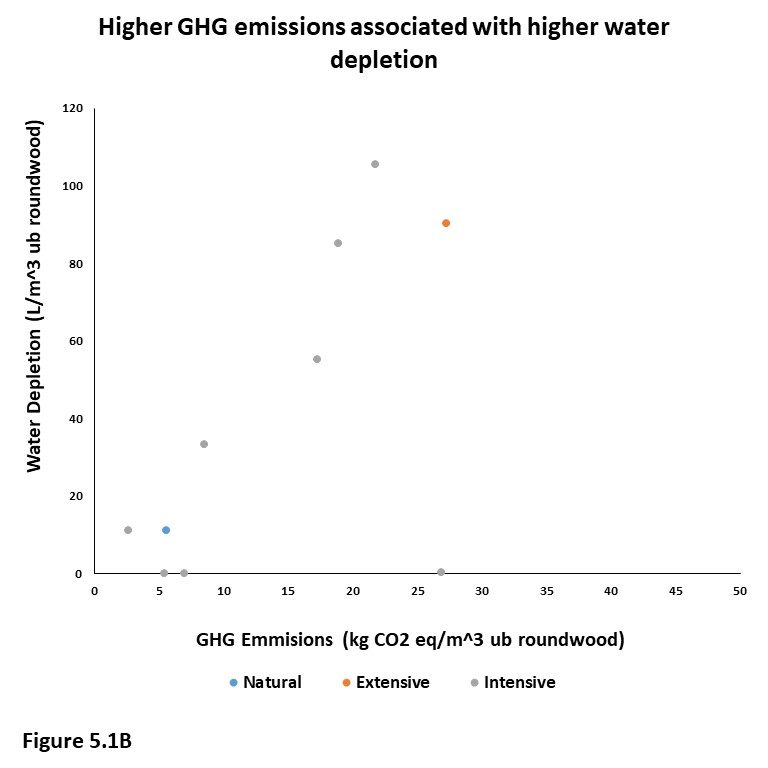
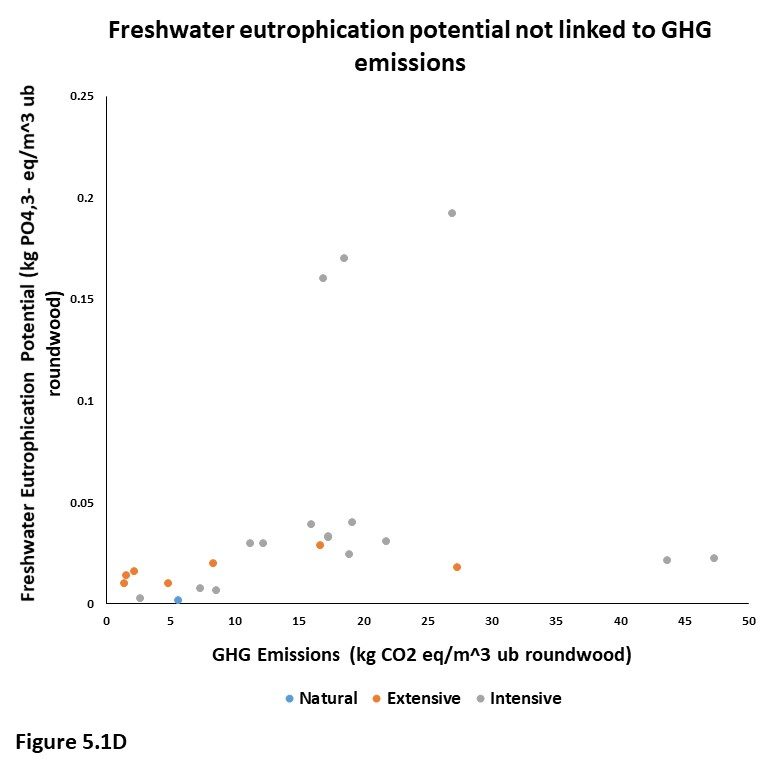
Figure 5.1: Land use, water depletion, and acidification potential, and freshwater eutrophication plotted against GHG emissions, color coded by production system
Trade-off
(5.1A) While there is significant spread in the data, higher GHG emissions were associated with lower land use. The trend is only apparent overall and isn’t pronounced in any individual production system, suggesting either that more data would result in no correlation or that the driver of the association transcends production system.
Co-benefit
(5.1B) Data on water depletion was relatively scarce, making conclusions necessarily weak. For the available points, higher GHG emissions were associated with higher water depletion, particularly in intensive systems. Datasets that do not report water depletion likely do so because the plantation is rainfed and not irrigated.
(5.1C) In both intensive and extensive production systems, higher GHG emissions were associated with higher acidification potential. This suggests that GHG emissions and acidification potential may share drivers.
No correlation
(5.1D) Excepting outliers, freshwater eutrophication potential was consistently below .05 kg PO4,3- eq regardless of production system and regardless of increasing GHG emissions. This suggests that the drivers of freshwater eutrophication potential transcend system type and are separate from the drivers of GHG emissions. If this is the case, efforts to reduce GHG emissions do not have a predictable effect on freshwater eutrophication.
Important considerations for production
Logging and hauling stage is highest impact across indicators
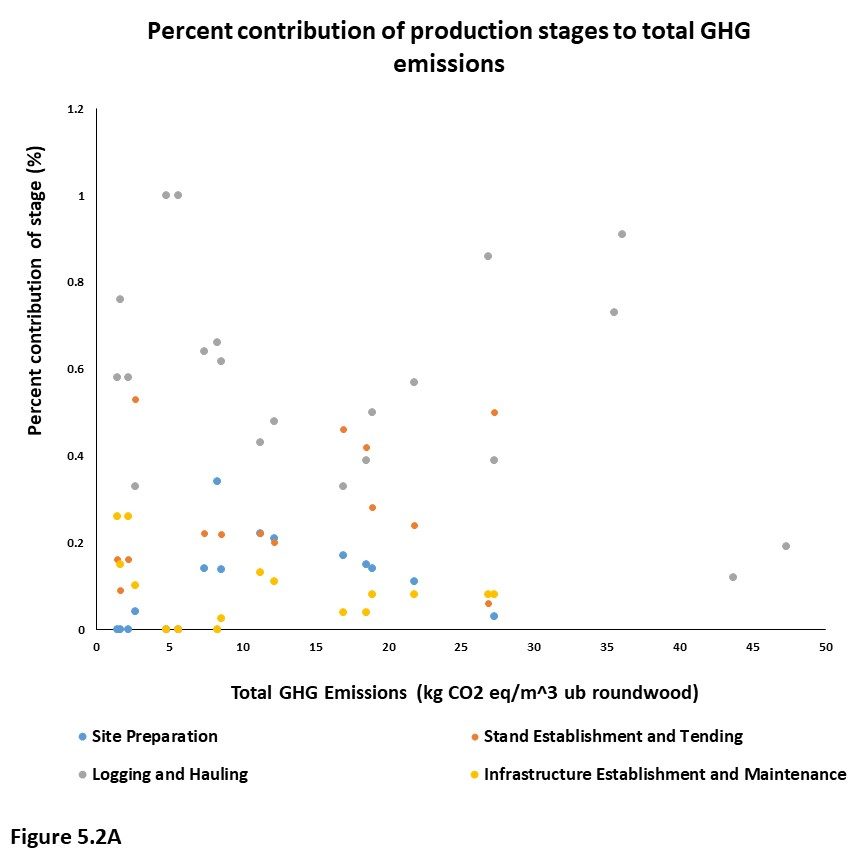
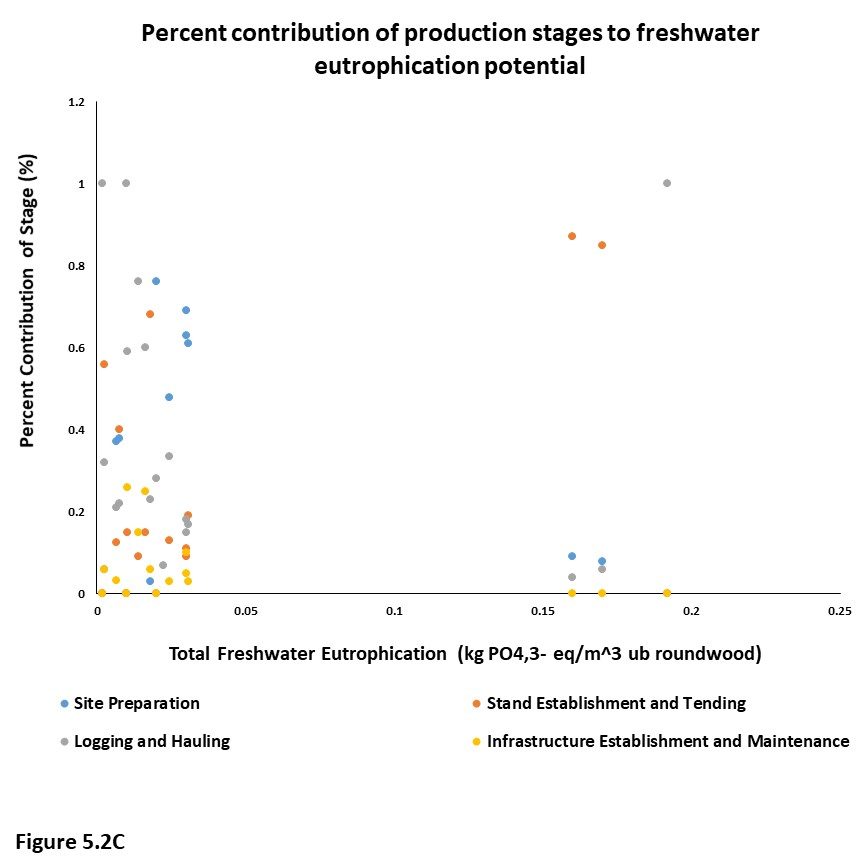
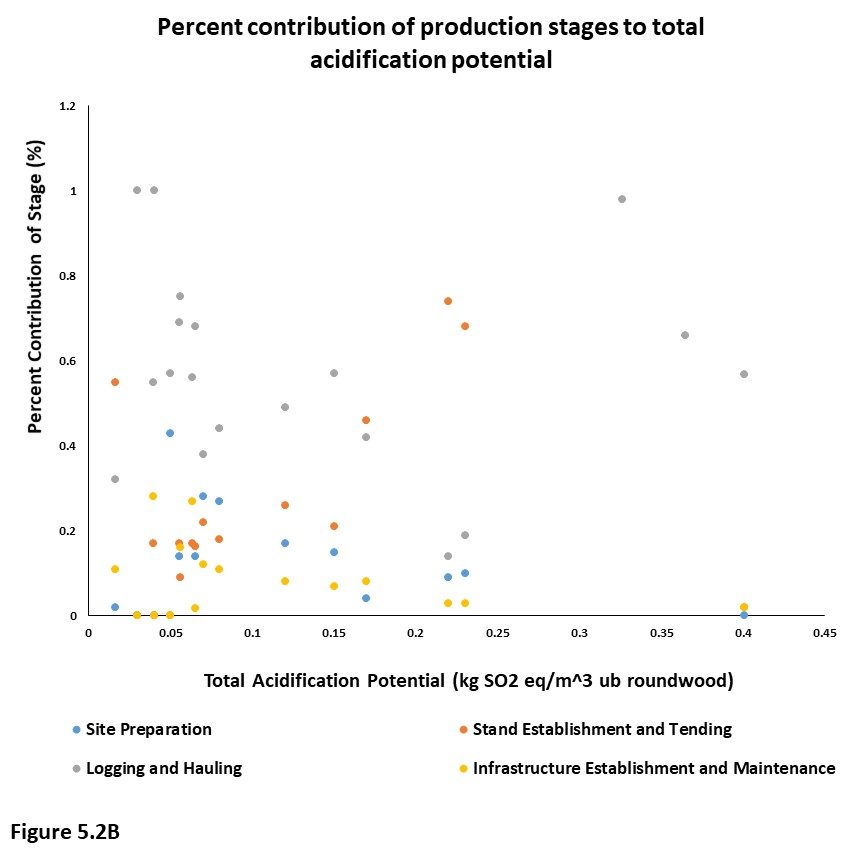
Figure 5.2: Percent contributions of production stages to impact of each indicator plotted against total impact, color coded by production stage
The logging and hauling stage has the highest impact on GHG emissions (5.2A) and acidification potential (5.2B), and is one of the highest impacts on freshwater eutrophication (5.2C), making it a significant target for impact reduction. While being the stage with the highest impact, it also displayed extreme variability, indicating significant room for industry improvement.
Rotation length is a weak predictor of impact
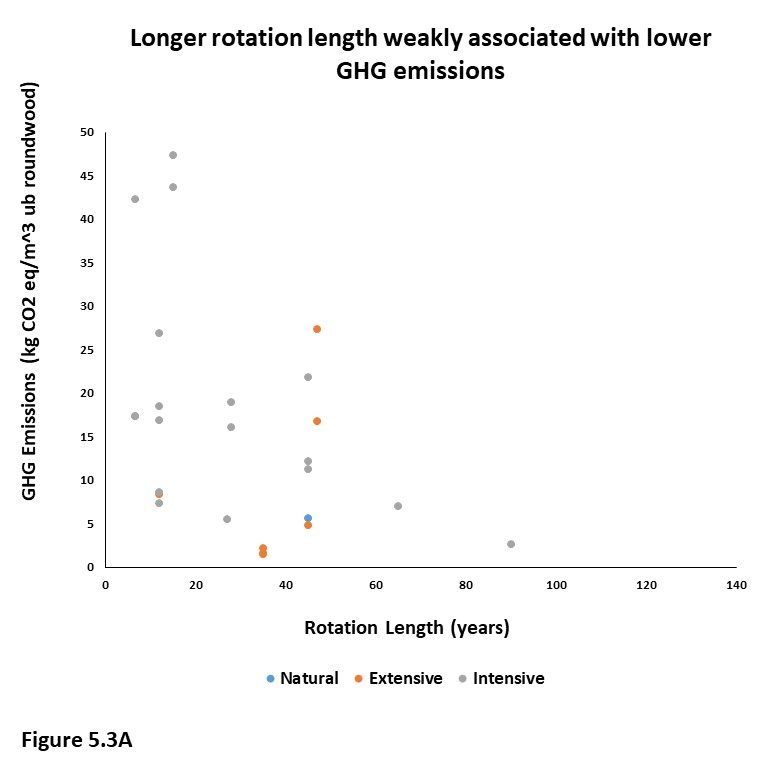
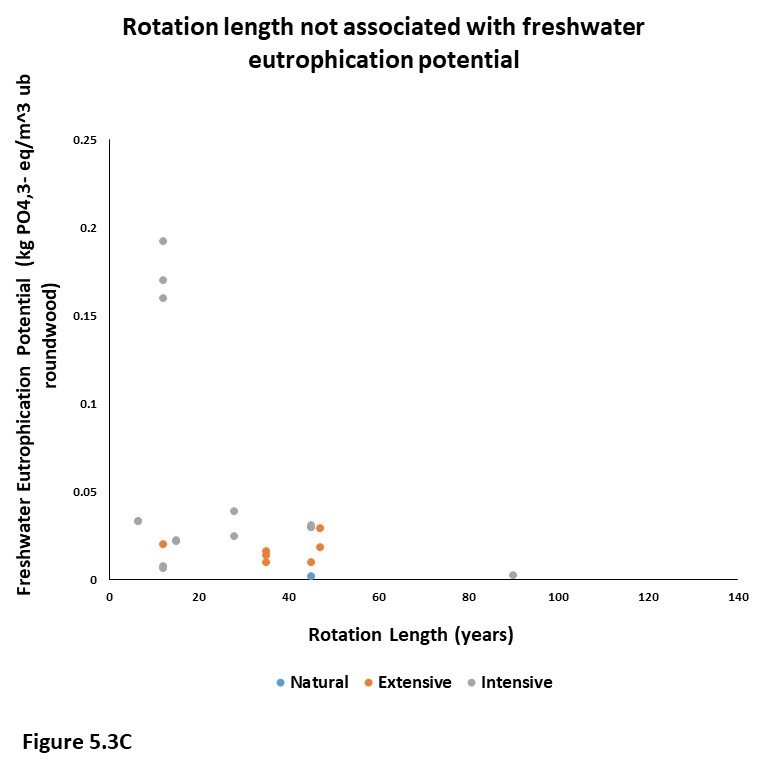
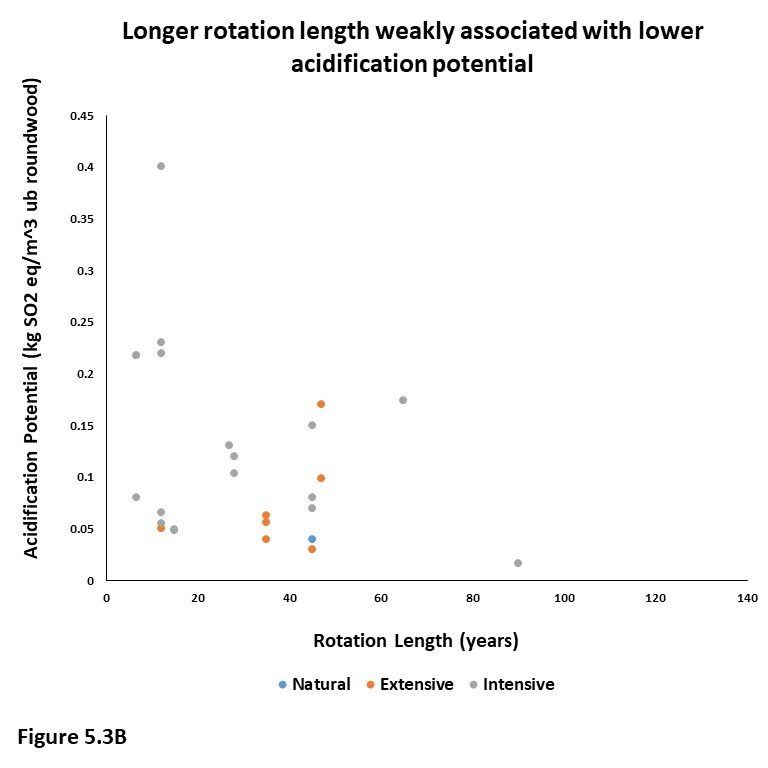
Figure 5.3: Rotation length plotted against GHG emissions, acidification potential, and freshwater eutrophication potential, color coded by production system
While shorter rotation length was weakly associated with lower impact on GHG emissions (5.3A) and acidification potential (5.3B), many short rotation plantations had very low impact in these areas, indicating that improving sustainability may not require focus on rotation length. Rotation length had no association with freshwater eutrophication potential (5.3C).
Tree species is not an effective predictor of impact
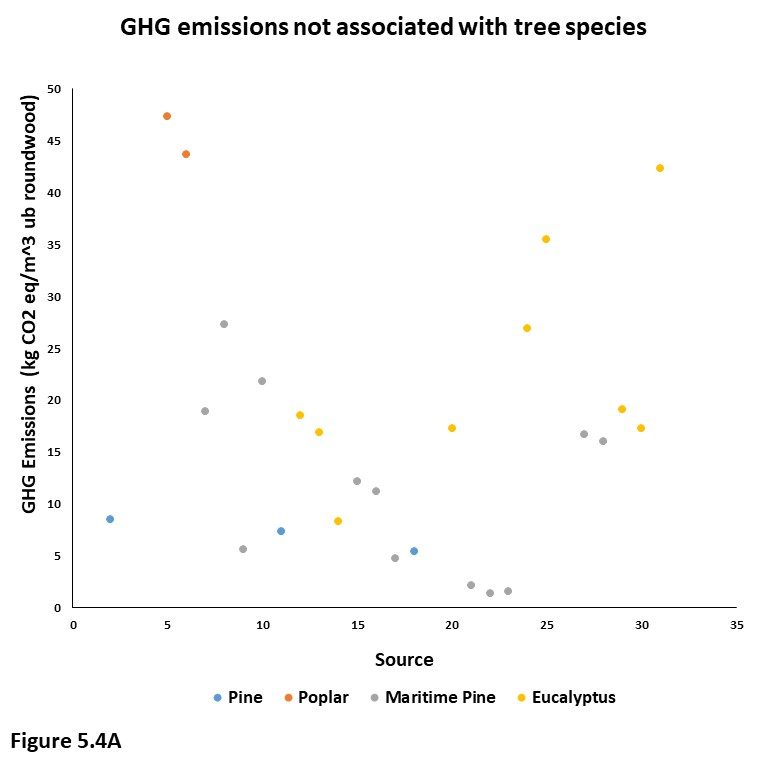
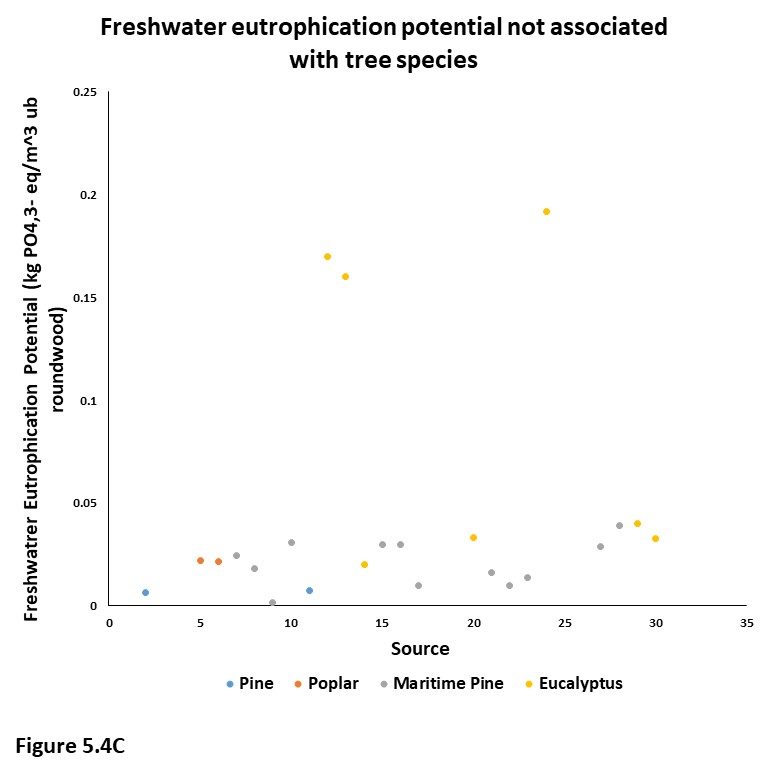
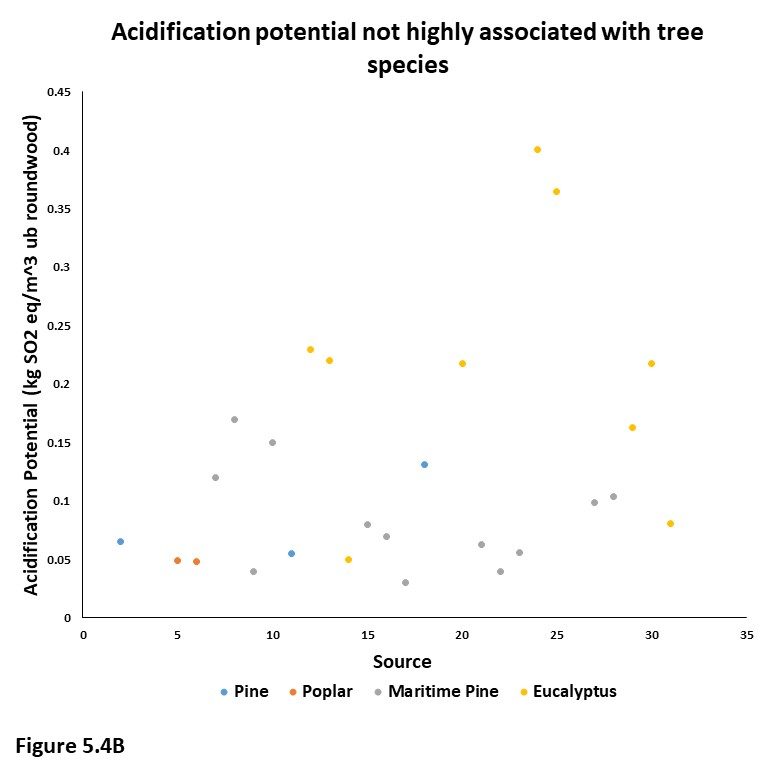
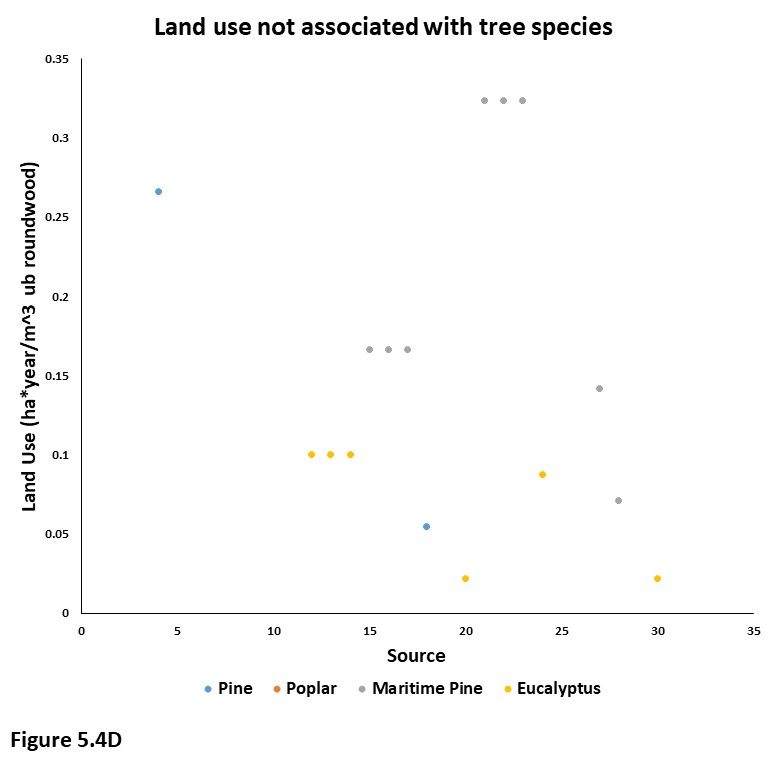
Figure 5.4: Rotation length plotted against GHG emissions, acidification potential, freshwater eutrophication potential, and land use, color coded by production system.
Impact was highly variable within and between tree species in GHG emissions, freshwater eutrophication, and land use (5.4A, 5.4C, 5.4D). Eucalyptus appears to be associated with higher acidification potential (5.4B) than the other analyzed tree species, but lack of data and outliers make it difficult to draw conclusions. Overall this indicates that tree species may not be a critical consideration to sustainability.
Future Steps
Next steps could involve investigating the relationship between acidification potential and GHG emissions using an analysis of machinery usage and fuel type. Alternatively, future inquiries could focus on deepening our analysis of land use since land conversion is one of the main drivers of environmental degradation caused by the forestry industry in Southeast Asia, where much of the world’s roundwood is sourced. Data on land conversion, soil carbon, and abiotic depletion could be procured for this reason. Finally, future work could involve building on our dataset to make it more representative of the major producers of roundwood, particularly China, India, Thailand and Indonesia.

