Overview
Along with rice and wheat, maize, also known as corn, provides at least 30 percent of the food calories for more than 4.5 billion people on the planet. Today, maize is the most important food crop in Sub-Saharan Africa and Latin America. However, while consumption is expected to increase two-fold, yields are expected to decline 10% by 2050 due to climate change, leading to higher global prices and malnutrition. Thus, it is especially important that producers find more land-, water-, and energy-efficient methods of farming maize while preserving livelihoods in developing parts of the world.
Summary of Analysis
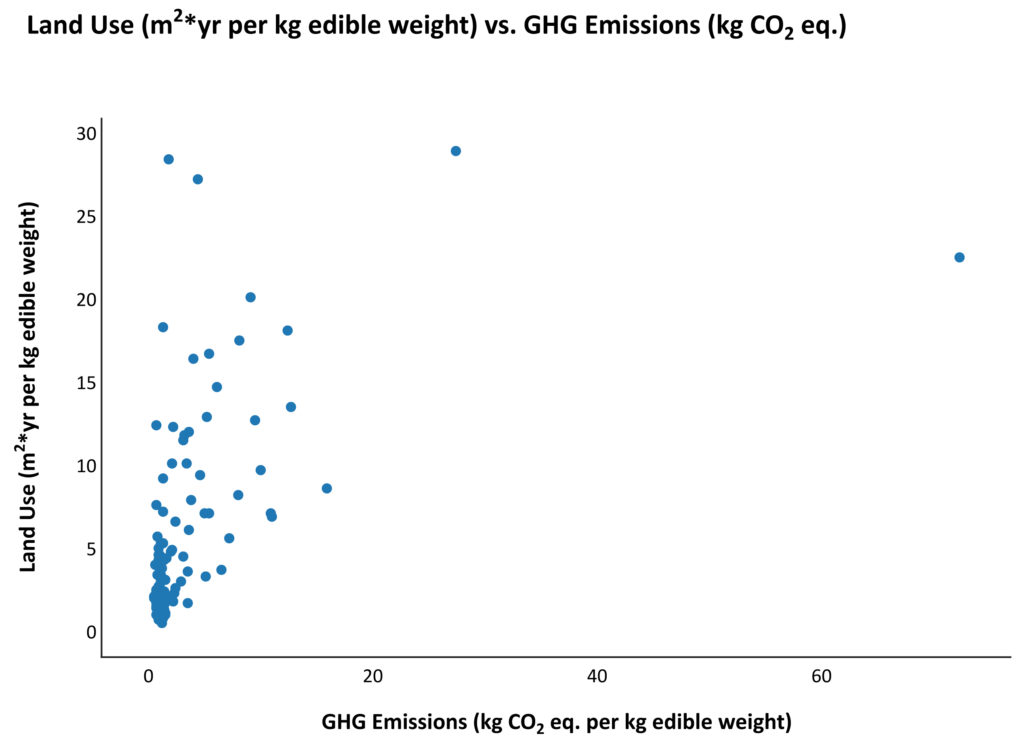
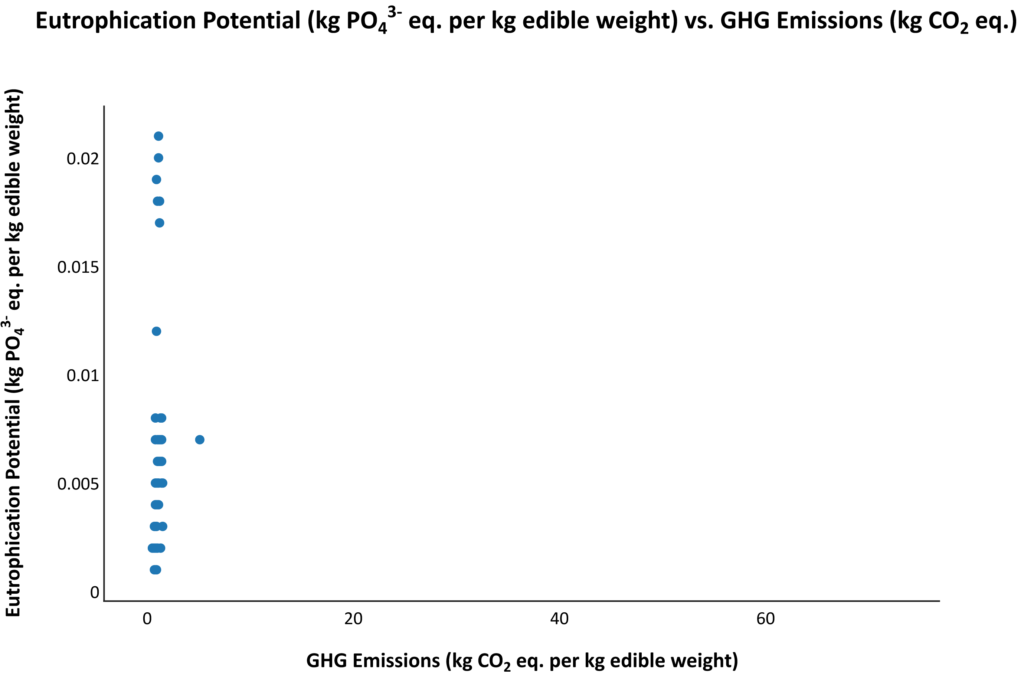
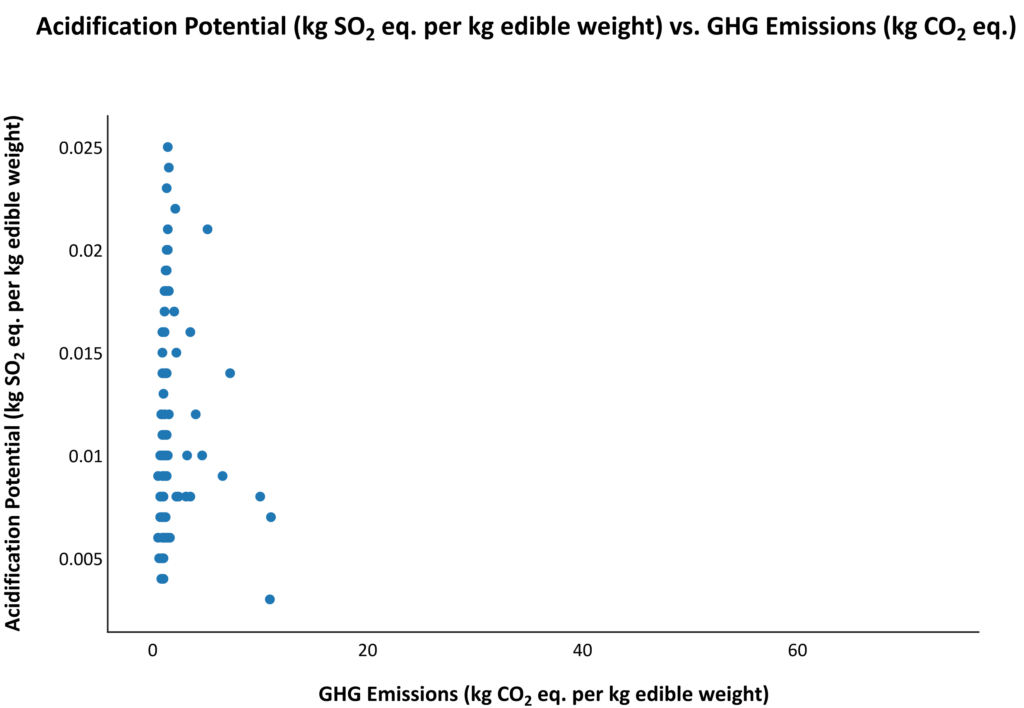
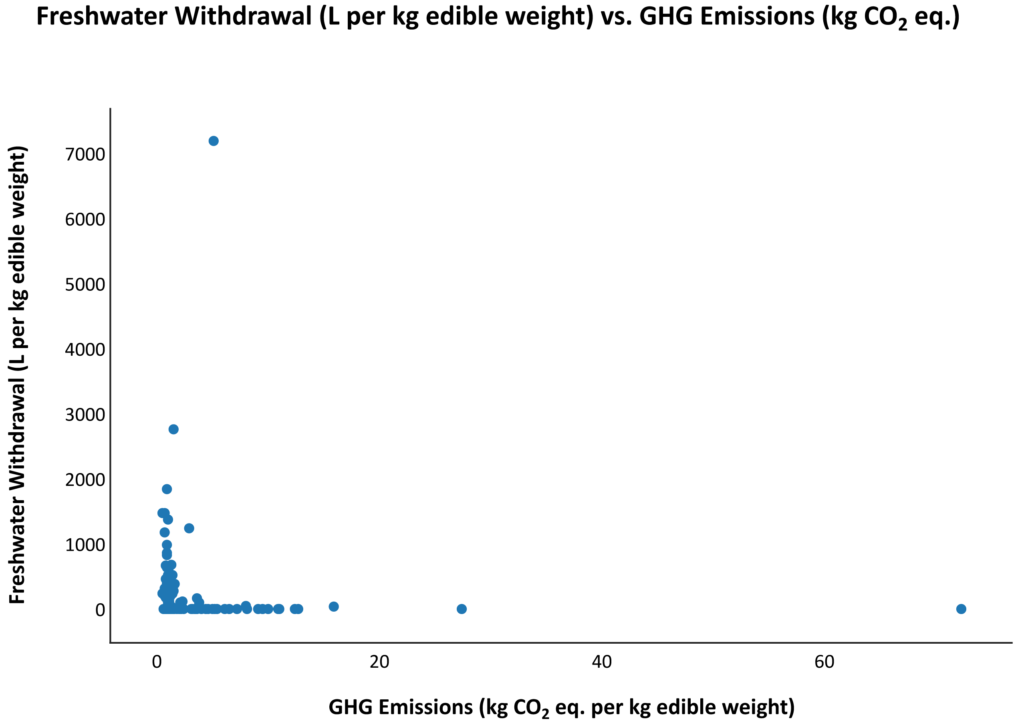
To conduct our analysis of maize, we used 152 data points from the Poore and Nemecek (2018) supplemental dataset. The raw data and code are available for use on GitHub. We compared four environmental indicators to GHG emissions (Figure 1.1), further analyzed land use and freshwater withdrawal from each stage of the production process (Figure 1.2), and finally mapped each indicator to geographic location (Figure 1.3).
Aggregate Indicator Analysis
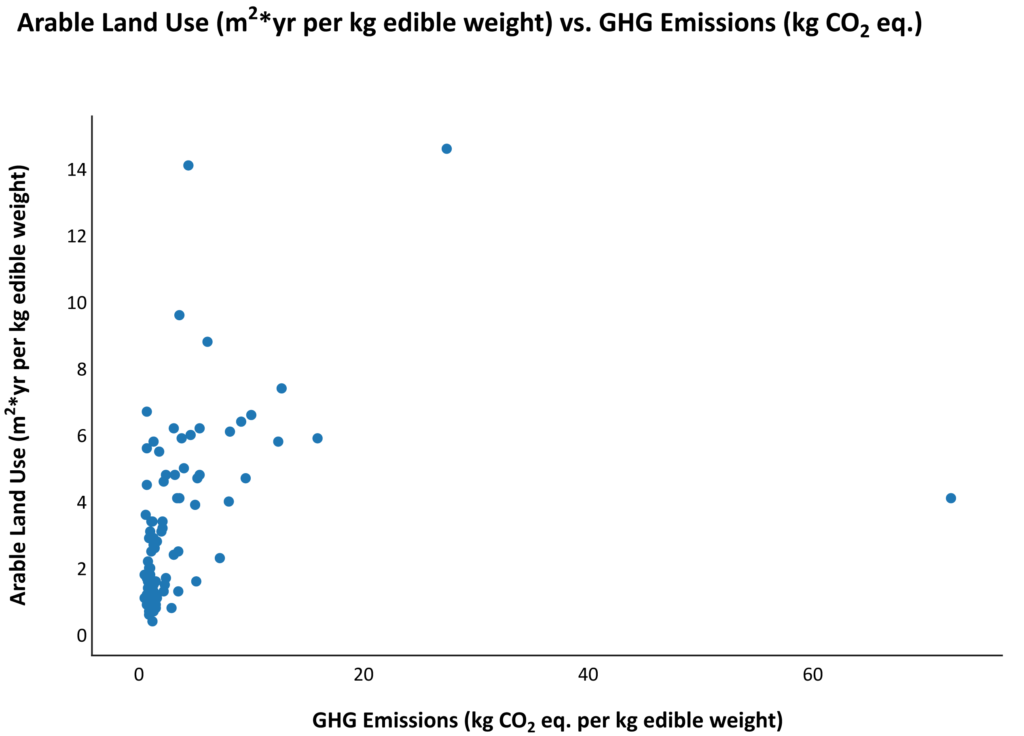
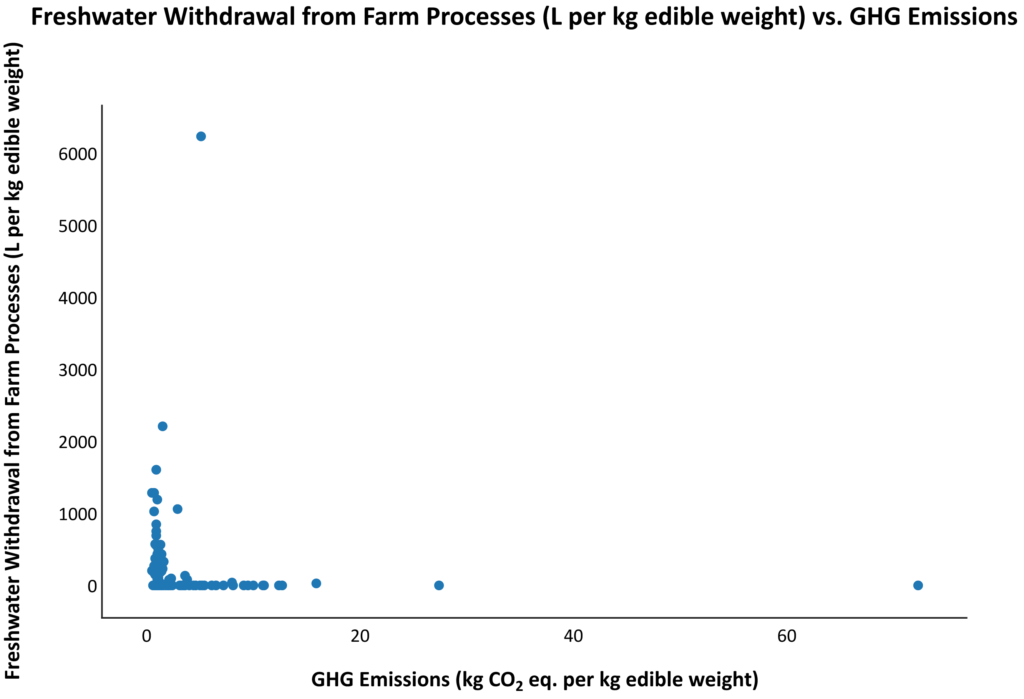
No apparent trends were found when comparing GHG emissions to the four other indicators (Figure 1.1). We also looked for trends after filtering by country and tested whether extreme cases were hiding a true trend by removing outliers with an interquartile method (not shown); these additional analyses did not yield any correlations. The lack of a clear relationship between GHG emissions and the other indicators across all analysis methods indicates that because maize production is so variable in different parts of the world and across such a large dataset, it is difficult to identify patterns with comparisons between broadly calculated indicators.
Figure 1.1. Scatter plots of four environmental indicators compared to GHG emissions for maize production show no apparent trend. With the exception of outliers, ranges for GHG emissions, land use, eutrophication potential, acidification potential, and freshwater withdrawal are normal compared to other studies with the same standardizations. Data from Poore and Nemecek (2018).
Impact of Specific Production Stages
We sought to quantify the impact of specific production stages, which may be more consistent around the world and show trends that are isolated to on-farm or post-farm processes. We isolated the emissions created during each production stage for the five indicators. There are no apparent correlations between indicator values for production stages and GHG emissions (Figure 1.2).
Isolating the farm production phase yielded similar results to the aggregate production data for land use and freshwater withdrawal because on-farm processes are the main contributors to those indicators. Therefore, increasing the efficiency of on-farm arable land use and freshwater withdrawal will most likely have the greatest impact on decreasing land use and freshwater withdrawal overall.
Figure 1.2. Plots of arable land use and freshwater withdrawal from the farm stage, with arable land use and freshwater withdrawal from the farm stage contributing the greatest to total land use and freshwater withdrawal, 45.2% and 85.2%, respectively. Data from Poore and Nemecek (2018).
Although there are no significant correlations between GHG emissions and the indicators (Figures 1.1 and 1.2), this lack of trends may be because of covariance between indicators or inconsistent reporting. It does not necessarily indicate a lack of trade-offs and incentivizes further research and data analysis on maize production, specifically by system type, climate, species, and seed.
Geographic Analysis of Land Use and GHG Emissions
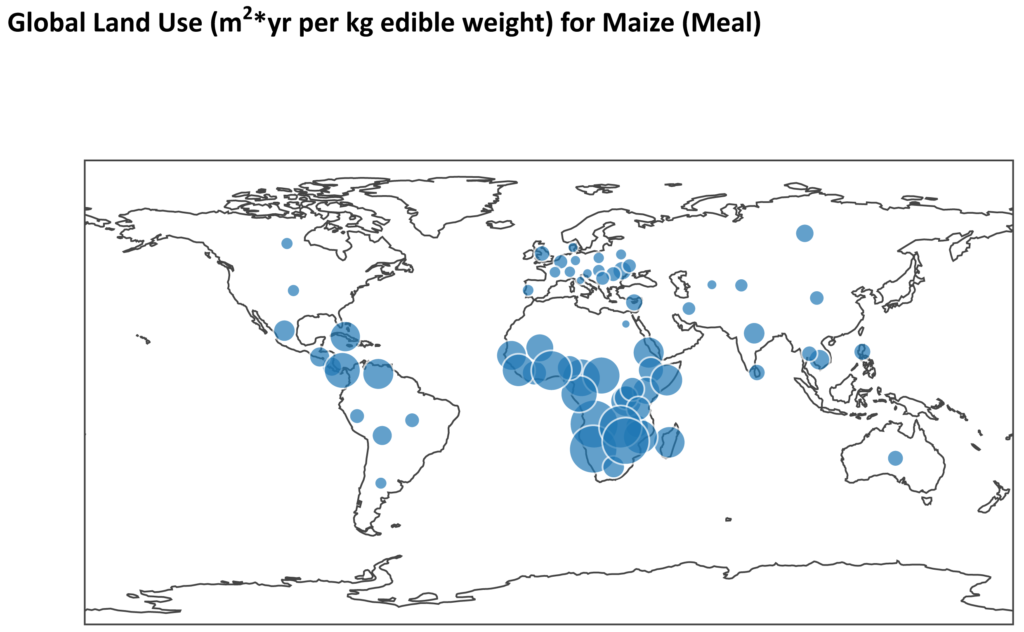
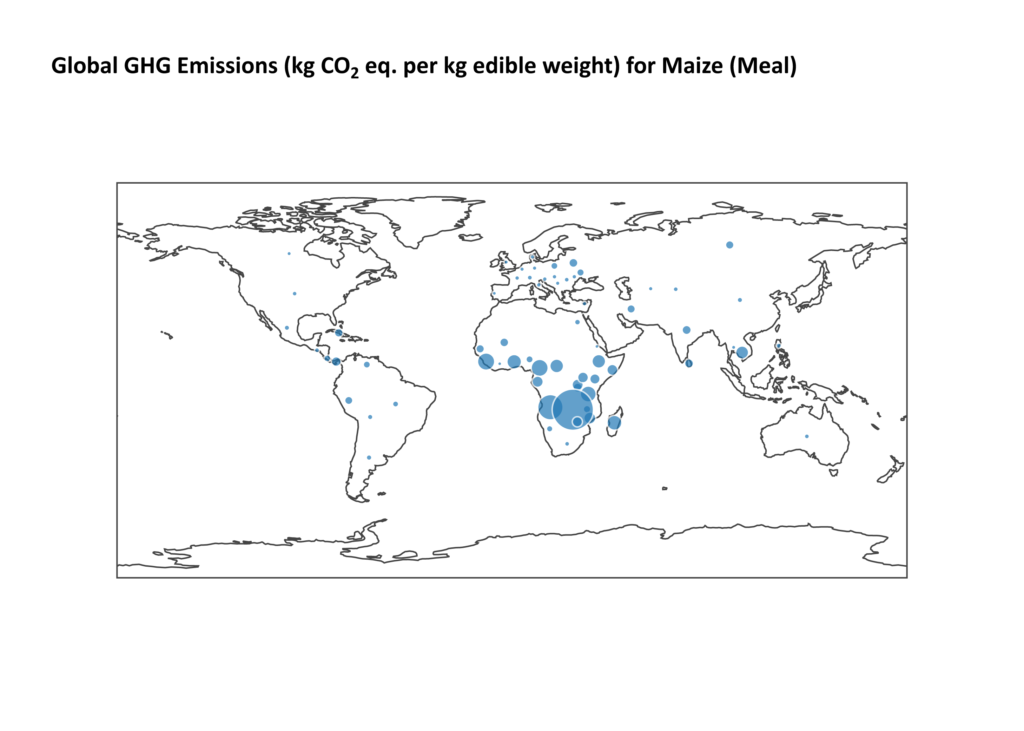
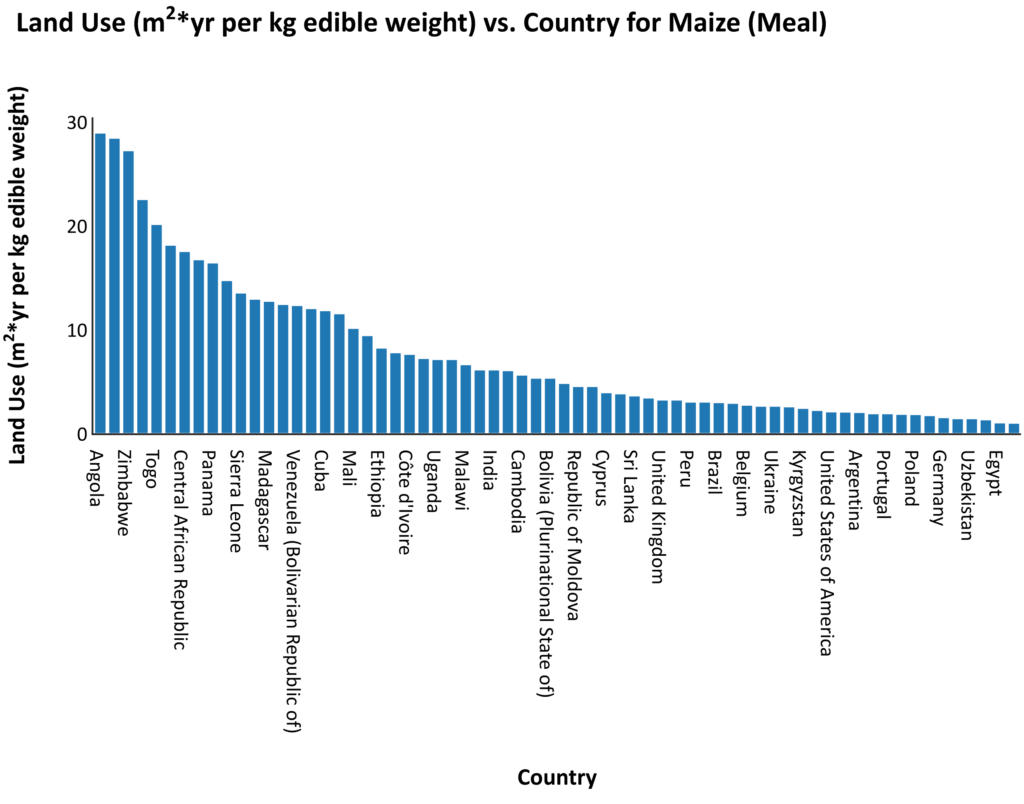
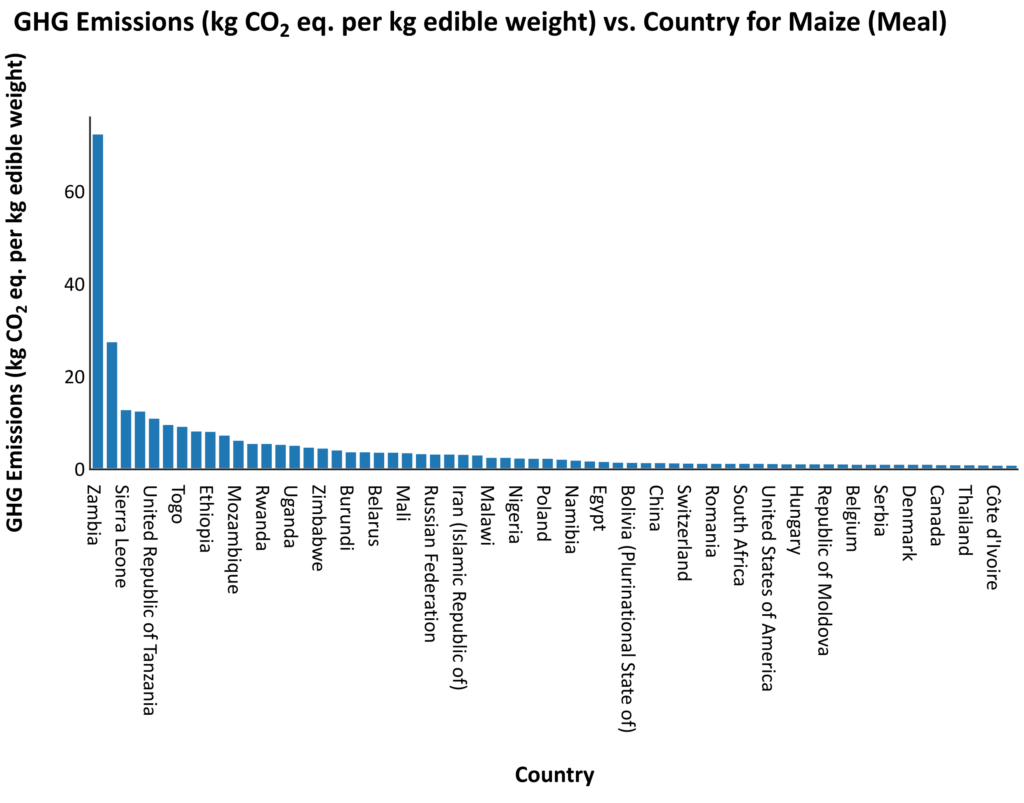
Figure 1.3 maps the relative magnitudes of land use and GHG emissions by country. The distributions for both map plots in Figure 1.3A and 1.3B show a similar concentration of values by country, although the overall magnitude of GHG emissions is lower than land use. In general, countries with high emissions have high land use values as well. This similarity in distribution may suggest that GHG emissions and land use are correlated for countries with emissions higher than 10 kg CO2 eq. per kg edible weight, which is also seen in the loose positive correlation in Figures 1.1A and 1.2A. This slight positive correlation between emissions and land use is strongest for countries that are outliers, such as Angola, Namibia, and Zambia. Unfavorable rainfall, limited fertile land, and limitations in technology may all contribute to the high land use and emissions per kg of edible weight of maize produced in these three outlier countries. Specifically, Angola and Zambia are two of four countries that are tied to the consistent agricultural trade deficit—having more imports than exports, and therefore causing a fiscal loss—in SSA.
Figure 1.3. Geographic analyses of land use and GHG emissions by country. Data from Poore and Nemecek (2018).
Figure 1.3C and 1.3D show relatively high land use and emissions for countries in SSA; these areas contribute 21.4% of the total land use in the Poore and Nemecek (2018) data (which accounts for >75% of global maize production), even though SSA only produces 7.5% of the world’s total maize product. In comparison to countries in SSA, the share of global production from the U.S. accounts for 37.6% of worldwide total annual product and contributes 25.8% of the total land use in the Poore and Nemecek (2018) data, only slightly more than SSA. Because of lower fertilizer input, drought, and other climate factors, the well-known yield gap phenomenon in SSA may account for these higher land use values.
From an equity viewpoint, a significant yield gap in maize production for developing countries is concerning, considering that population growth in areas like SSA necessitates importing food to meet nutritional needs. This reduces the quality of produce, increases the occurrence of food deserts, makes countries dependent on foreign imports to address hunger, and increases emissions from processing, packaging, and transportation. Thus, bringing more efficient maize production methods to developing parts of the world can make a far higher impact on environmental indicators, quality of life, and the economy than focusing on countries like the U.S.

