Overview
Coffee is one of the most popular beverages in the world, likely because it contains the stimulant caffeine. Global coffee consumption has recently decreased due to the COVID-19 pandemic, as the effort to combat the spread of the virus caused many patrons of coffee shops to stay at home. While coffee production, like other commodities, may contribute to negative environmental effects, coffee crops are also sensitive to climate change, and if climate change continues on its current path, coffee production may be forced to move to a more temperate climate.
Impact Intensity Analysis
We initially compared the range of environmental impacts across the producing countries. From this analysis, we can see that the country with the highest impact intensity differs across impacts.
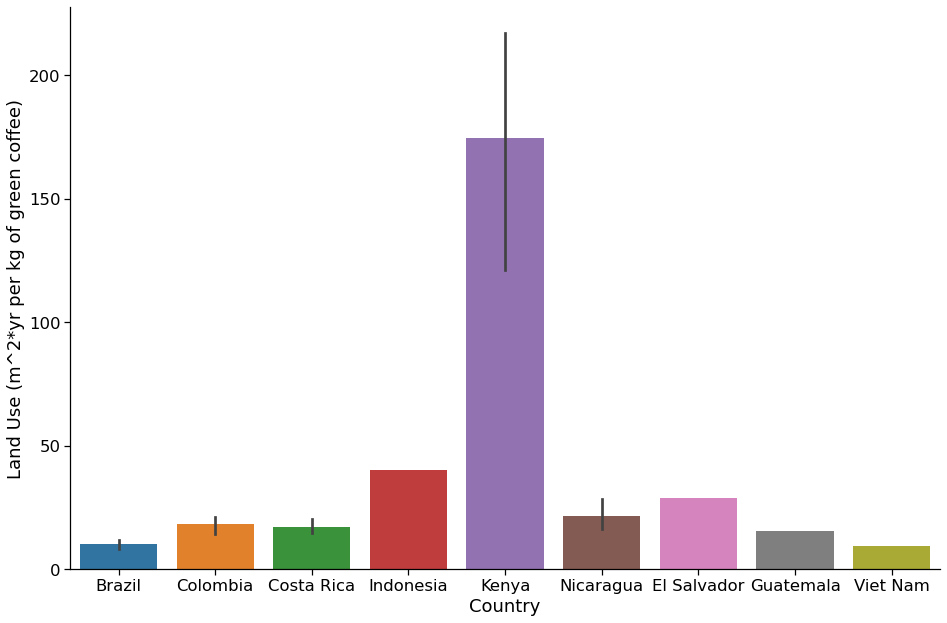
In Kenya, land use appears to be higher than all other countries included in the data (Figure 4.1). Because land use captures yield, this would indicate that Kenya would use more land to produce the same amount of coffee as other countries.
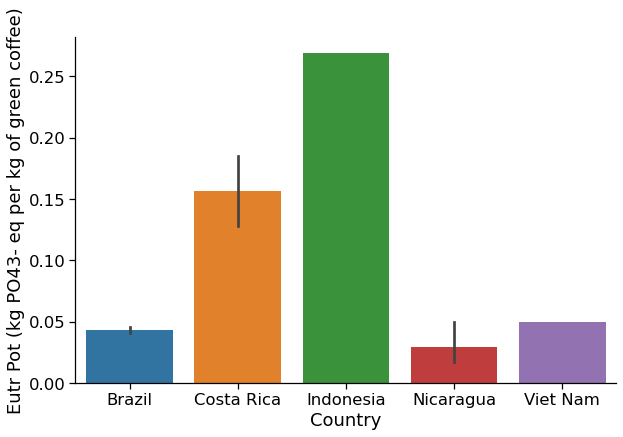
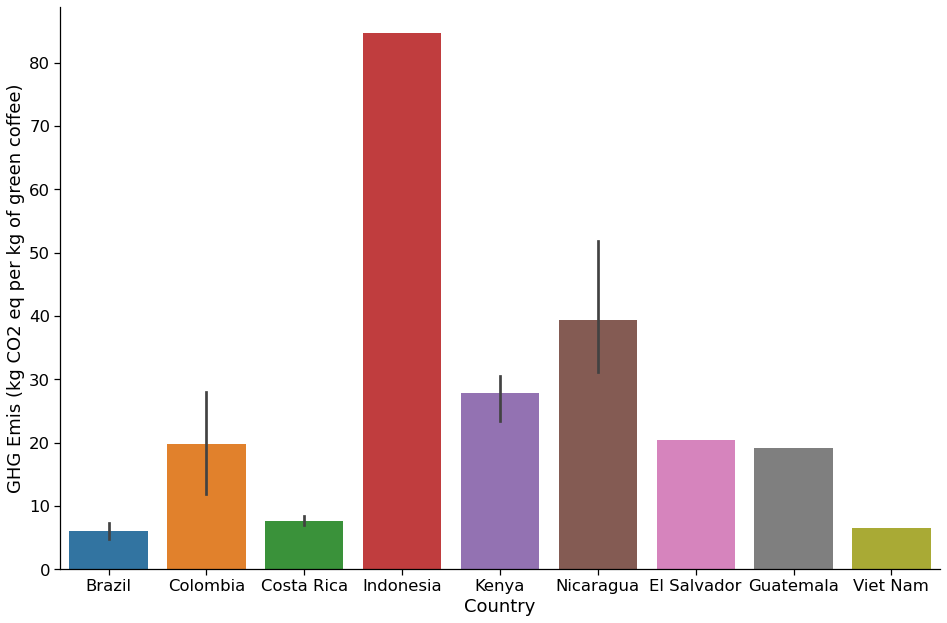
Figure 4.2. Bar graphs of average eutrophication potential and GHG emissions by country. Data from Poore and Nemecek (2018). Error bars depict a 95% confidence interval and are not present where there is only one data point.
Farms in Nicaragua and Brazil appear to have low eutrophication potential; Brazil has low GHG emissions intensity, while Nicaragua’s is higher. Furthermore, while Costa Rica has low GHG emissions, the eutrophication potential is relatively high (Figure 4.2a, 4.2b). Note that only one data point in Vietnam and Indonesia had a value for eutrophication potential. Additionally, there is only one data point available for Vietnam, El Salvador, Guatemala, and Indonesia. While there is only one data point in Indonesia, it appears that some of the high emissions there stem from land-use change.
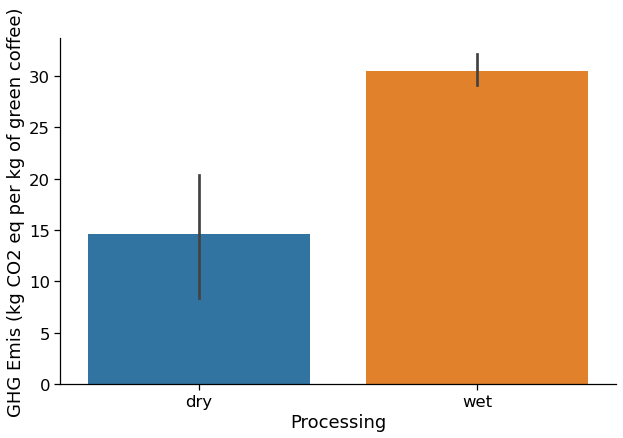
Figure 4.3. A bar graph of average emissions by processing method. Data from Poore and Nemecek (2018). Error bars depict a 95% confidence interval and are not present where there is only one data point.
Coffee farms that employ wet processing methods tend to have higher GHG emissions (Figure 4.3). The majority of emissions from wet processing come from the wastewater generated. While we did not utilize freshwater data in our analysis, it has been established that the processing stage of coffee production also heavily contributes to water use.
Trade-off Analysis
We then compared the GHG emissions with the associated eutrophication potential and land use to see if there were trade-offs across these impacts.
When looking at these various environmental impact factors plotted onto these graphs, there appeared to be no clear trends. However, when examining these factors based on country, coffee species, and organic vs conventional systems, clearer trends did emerge.
Country trends
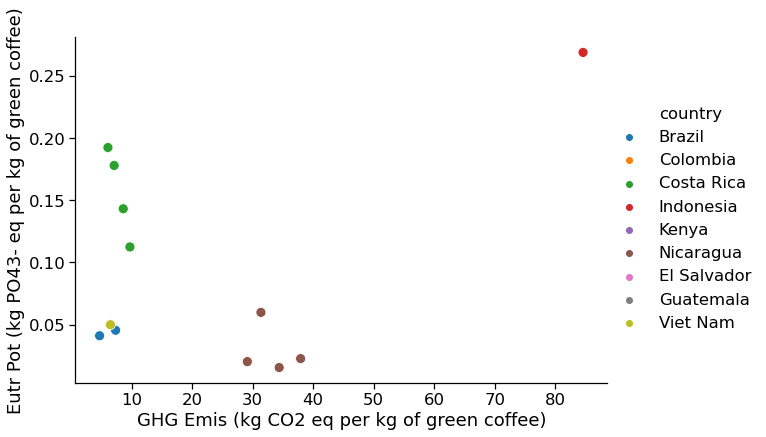
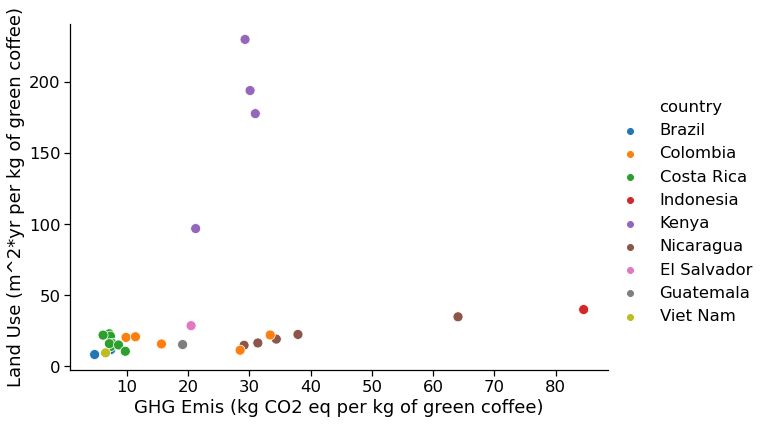
Figure 4.4. Scatterplots of eutrophication potential and land use vs GHG emissions by country.
The impacts by country appear to be clustered, and often appear weakly related. For example, GHG emissions and eutrophication potential appear to be negatively correlated in Costa Rica (Figure 4.4a, green dots) specifically, and GHG emissions and land use appear to be positively correlated in Nicaragua and negatively correlated in Costa Rica (Figure 4.4b, brown and green dots respectively). In Nicaragua, the majority of GHG emissions appear to come from land-use change, which explains the upwards trend: as more land is converted to farmland, GHG emissions from the conversion increase. No correlations appeared between GHG emissions vs acidification potential between countries.
Coffee species trends
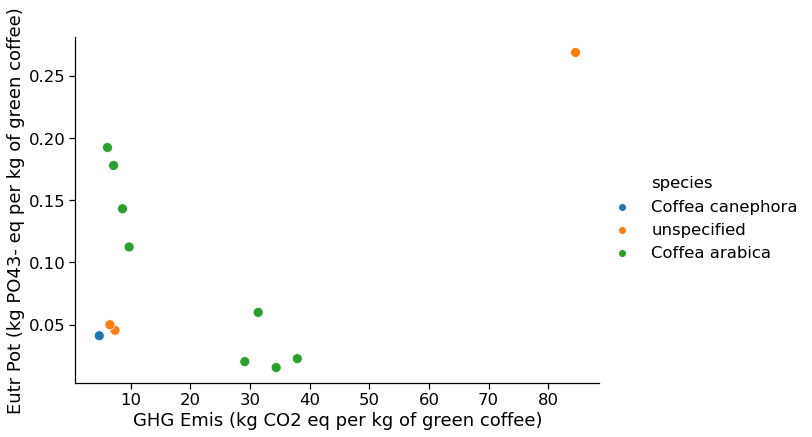
Figure 4.5. A scatterplot of eutrophication potential vs GHG emissions by species.
When examining the environmental factors based on coffee species, a negative correlation between GHG emissions and eutrophication potential was found for arabica coffee (Figure 4.5). However, some studies did not state which coffee species was used, and if some of the unspecified data was Coffea arabica, that could impact the strength of the linear correlation. No correlations between emissions and land use or acidification potential were found between species.
Organic and conventional farming
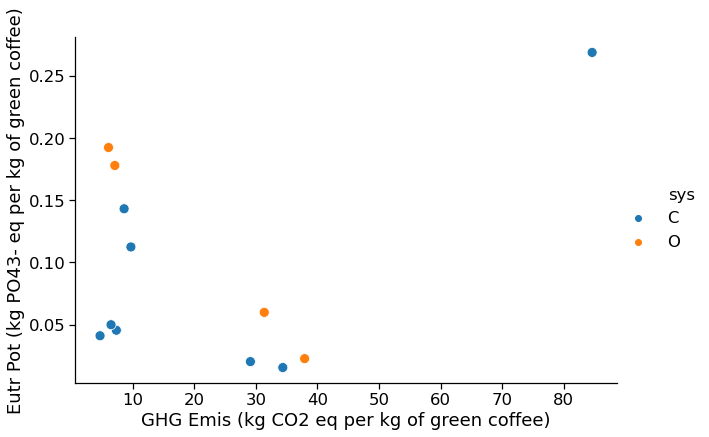
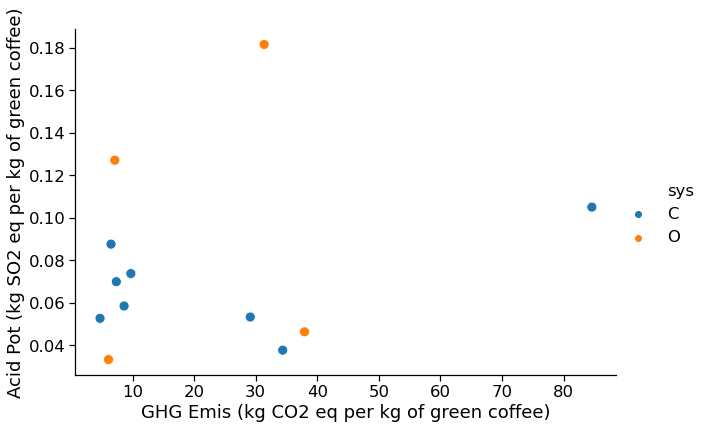
Figure 4.6. Scatterplots of eutrophication potential and acidification potential vs GHG emissions by organic (O, orange dots) or conventional (C, blue dots) farming.
A potential negative correlation between emissions and eutrophication potential was found for organic farming (Figure 4.6a). However, there are only four data points that are organic and have eutrophication potential data, so there is not strong evidence for this correlation. There also appears to be a negative correlation between emissions and acidification potential in conventional farming (Figure 4.6b). No significant correlations were found between emissions and land use within these systems.
Moving Forward
Despite organic coffee production being lauded as a more sustainable way to produce coffee, the data did not show any significant decrease in environmental factors with organic coffee. While there are not as many data points from organic coffee farms, the organic coffee trend has been criticized as not having a significant positive impact. Furthermore, although demand for organic coffee may be growing, it appears that farmers who grow organic coffee will not receive much of a benefit from it in the long term. Organic certifications require that coffee farmers use agricultural practices that may produce less yield. If they are not as effective as previously thought, then the focus needs to turn to practices that are effective, and better economic incentives should be offered for growing coffee with these practices.
Because of the presence of what appears to be placeholder values for freshwater use, energy use, soil phosphates, and soil nitrates, we decided not to use these factors in our analysis. Further research should use reliable values for these categories and compare them to the factors analyzed above.

