Overview
Beef represents 22% of meat production globally, but also is responsible for approximately 37% of GHG emissions produced by the agricultural sector. Additionally, the protein input to energy output for beef cattle is 40:1, which is extremely inefficient in comparison to other sources of food. So it is critical that we find ways to make beef production more efficient in terms of greenhouse gas emissions, without significantly increasing other environmental impacts.
In order to determine the trade-offs associated with decreasing the GHG emissions of the beef industry, the AgImpacts team used data from Poore and Nemecek (2018) to create visualizations of the relationship between GHG emissions and other environmental indicators. Beef is generally produced from either beef herd cattle, or dairy herd cattle. Beef herd cattle are bred specifically for beef production, meaning that they are more massive and muscular than dairy herd cattle, which are bred primarily for their milk. In this section, we separately analyze these production systems in order to find any similarities and differences between them. For beef from beef herd cattle, this dataset included 105 points of data. For beef from dairy herd cattle, the set included 40 points of data. The data for dairy herd cattle excluded two data points from beef production in Mexico because the environmental impacts were extreme outliers compared to the rest of the data.
Environmental Impact Comparisons
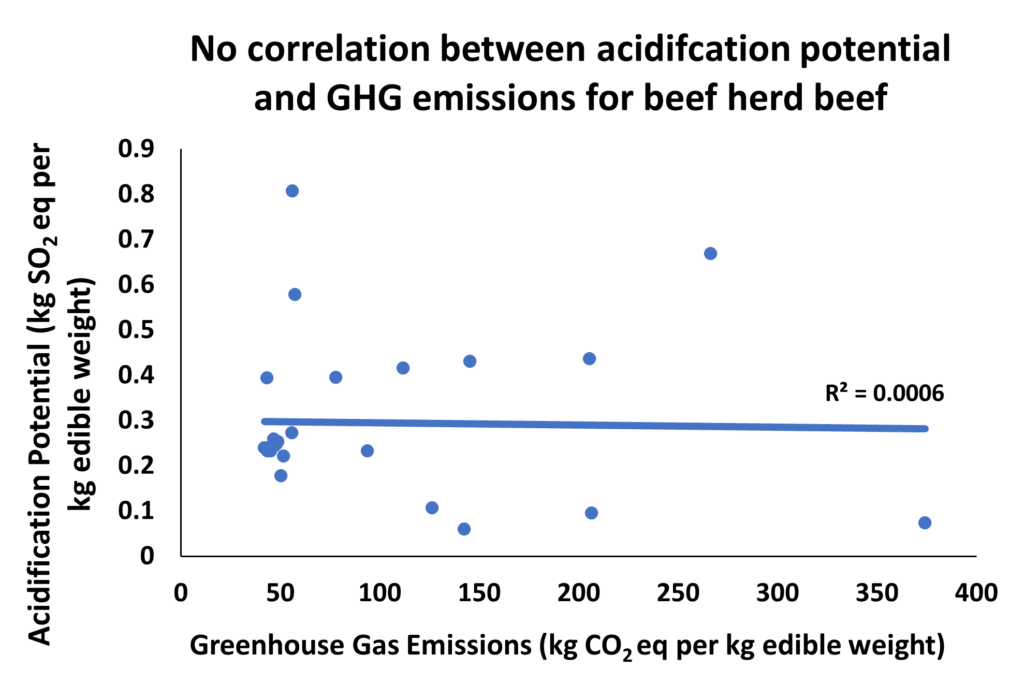
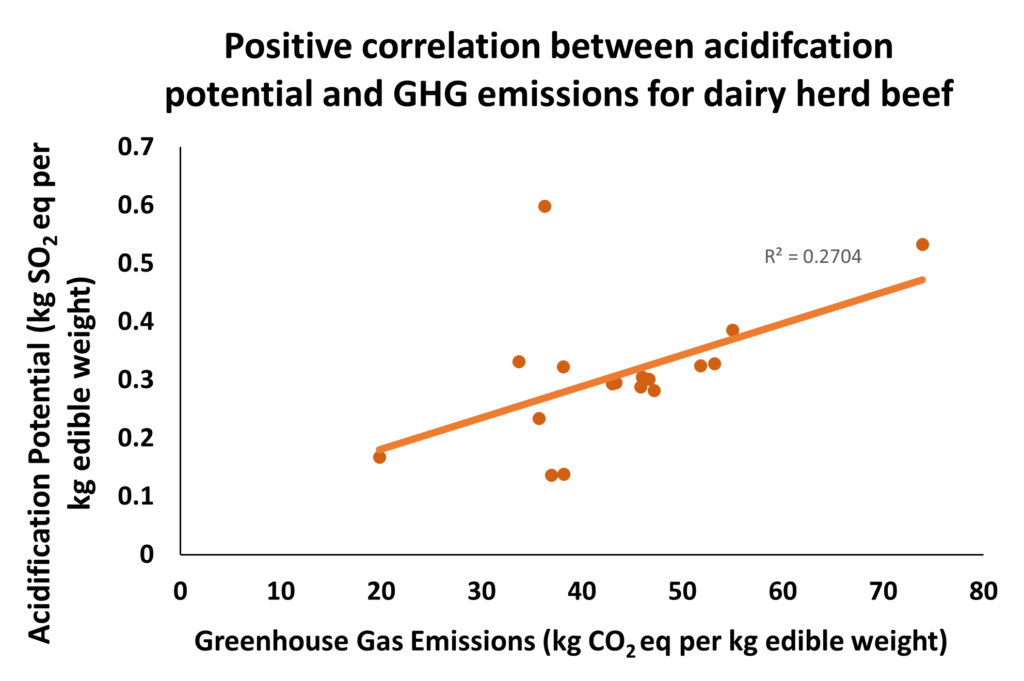
Figure 6.1. Charts of acidification potential plotted against greenhouse gas emissions for beef from beef herd cattle (left) and dairy herd cattle (right). Data from Poore and Nemecek (2018).
Acidification potential seems to have little correlation with GHG emissions for beef herd cattle (Figure 1, left), but notably, beef produced from dairy herd cattle shows a positive correlation (Figure 1, right). This implies that for both types of beef production, there is not a detrimental increase in the release of acidifying compounds when GHG emissions are reduced. For dairy herd cattle, it even seems that methods which reduce GHG emissions also result in reduced release of acidifying compounds.
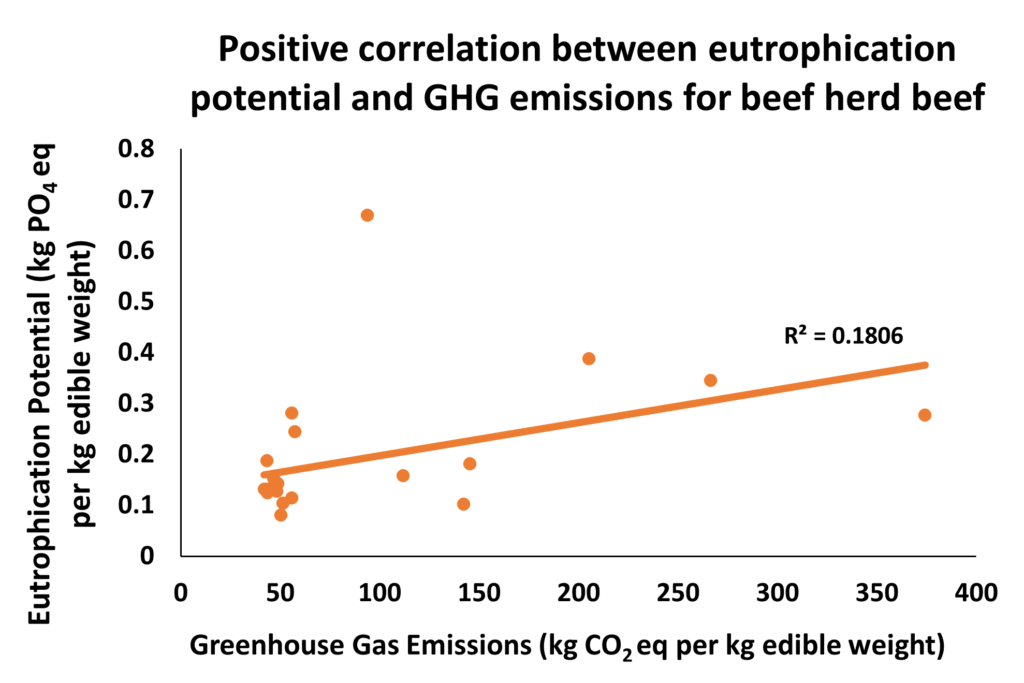
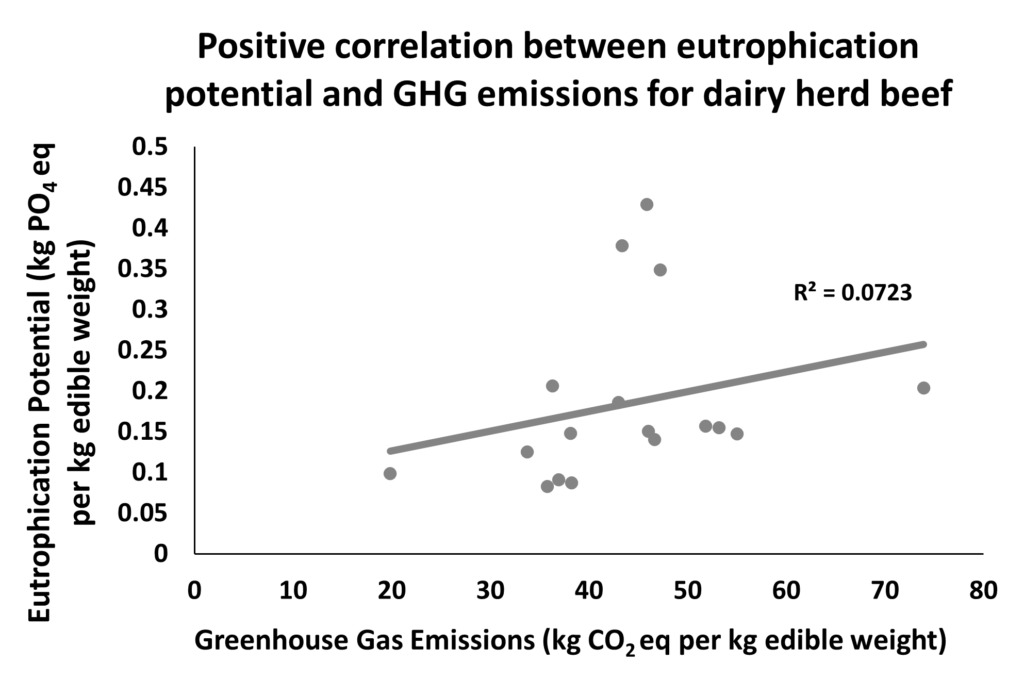
Figure 6.2. Charts of eutrophication potential plotted against greenhouse gas emissions for beef from beef herd cattle (left) and dairy herd cattle (right). Data from Poore and Nemecek (2018).
Eutrophication potential shows a somewhat different relationship, for both beef herd cattle and dairy herd cattle there is a positive correlation between GHG emissions and the release of eutrophying compounds (Figure 6.2). This implies that methods which decrease GHG emissions also result in lower eutrophication potential.
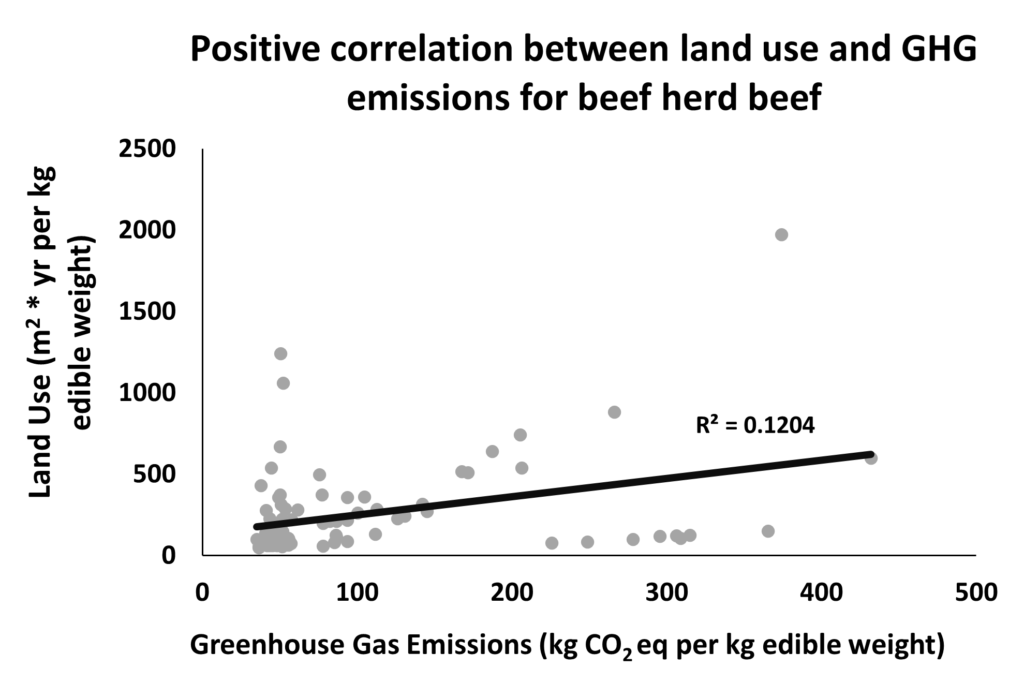
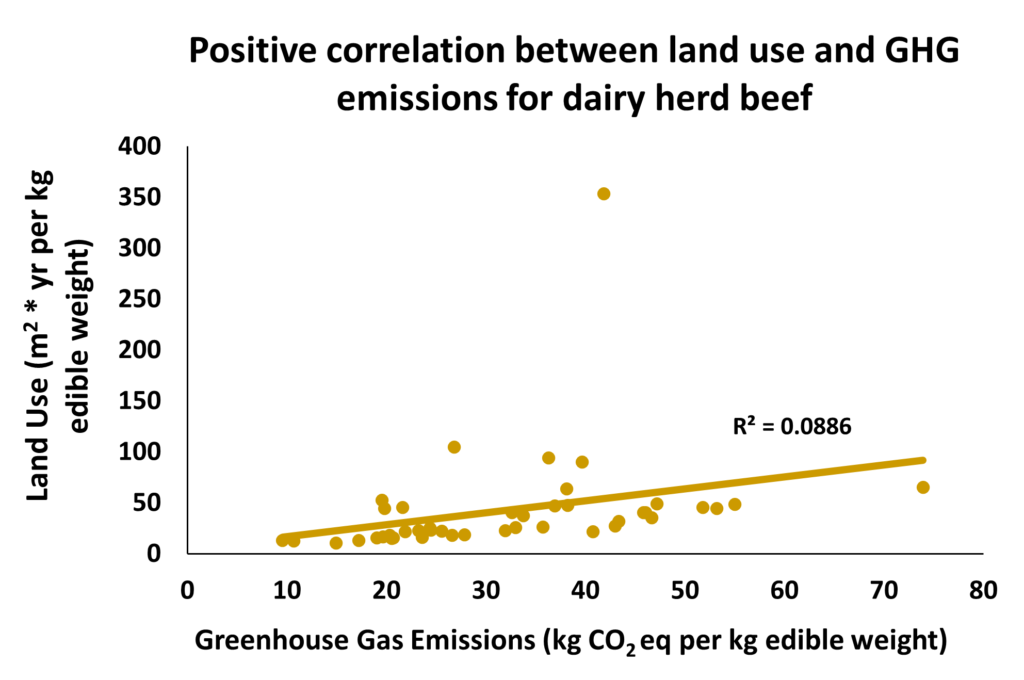
Figure 6.3. Charts of land use plotted against greenhouse gas emissions for beef from beef herd cattle (left) and dairy herd cattle (right). Note the different scales between the dairy herd cattle and beef herd cattle. Data from Poore and Nemecek (2018).
Land use shows a similar relationship between beef herd and dairy herd cattle. Both production systems indicate a positive correlation between land use and GHG emissions (Figure 6.3), suggesting that farms more efficient in terms of GHG emissions are also more efficient in their use of land.
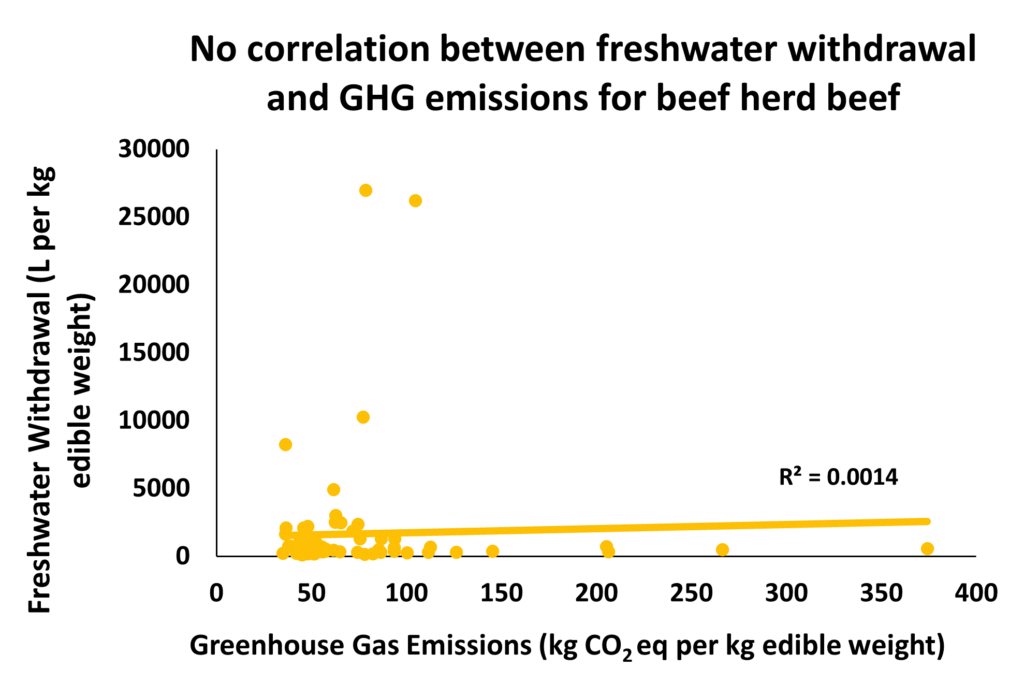
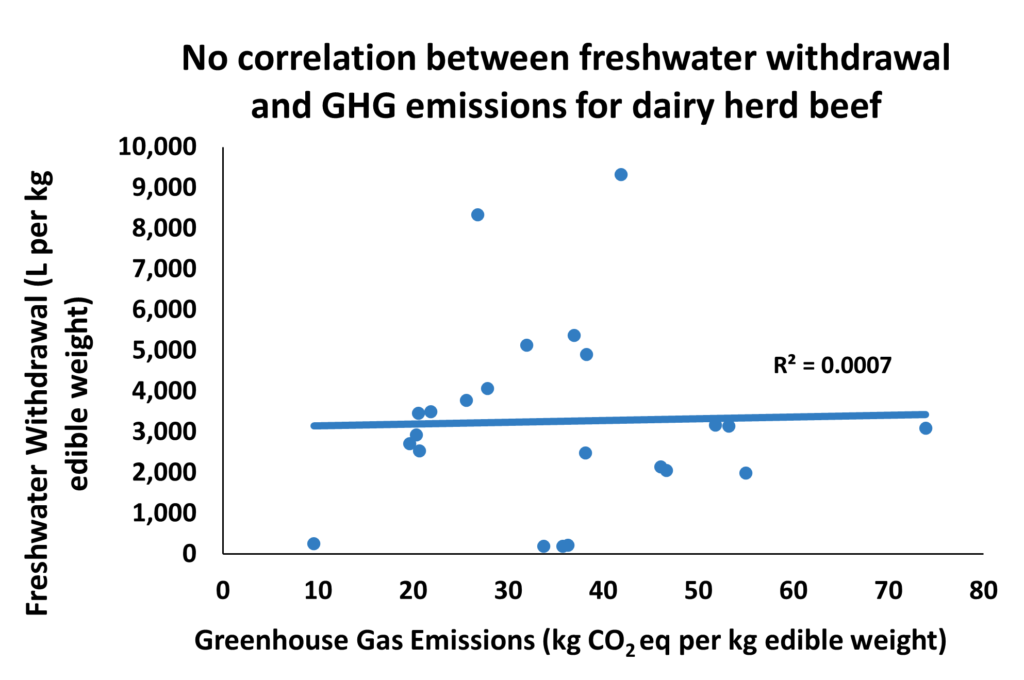
Figure 6.4. Charts of freshwater withdrawal plotted against greenhouse gas emissions for beef from beef herd cattle (left) and dairy herd cattle (right). Note the difference in scales between the beef herd and dairy herd data. Data from Poore and Nemecek (2018).
For both beef herd and dairy herd cattle, there seems to be no correlation between GHG emissions and freshwater withdrawal (Figure 6.4). This implies that freshwater withdrawal is unaffected by strategies which reduce GHG emissions in beef production. The majority of freshwater used in beef production is due to water consumed for crop growth, which is processed into feed for cattle.
In all examples except the relationship between dairy herd eutrophication potential and GHG emissions, it seems that environmental consequences of beef production systems are either reduced or unaffected by the use of techniques which result in lower GHG emissions. But there is still a significant difference between the lowest and highest levels of GHG emissions. Based on the apparent connection between GHG emissions and other environmental indicators (Figures 6.1, 6.2, 6.3), the difference implies that there is also a disparity among local environmental impacts of beef production. If there exists a disparity, then it could be possible to target beef production systems associated with greater environmental consequences, and potentially find a way to improve their efficiency. This would result in a more significant environmental improvement than spending resources to improve systems which are already comparably quite efficient.
The Unequal Intensity of GHG Emissions by Income Level
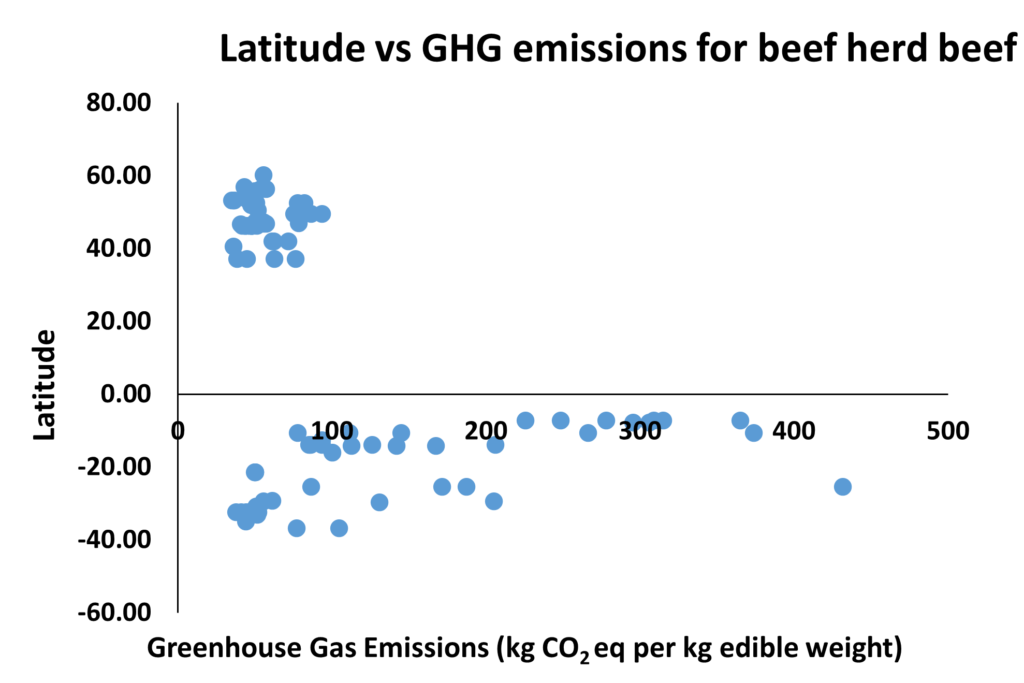
To work towards identifying the source of this disparity in GHG emissions, the AgImpacts team chose to compare latitude and GHG emissions, based on a hypothesis that climate could affect GHG emissions of cattle. Although latitude is not the only indicator of climate, this comparison was intended to be a first step in the investigation. Note that for some data points, latitude was not listed by Poore and Nemecek (2018), so the AgImpacts team assumed an average latitude of the region, if given, or the average latitude of the country, if region was not available. The hypothesis was not supported; instead, an interesting trend emerged. There appear to be distinct clusters of data points with relatively low greenhouse gas emissions (Figure 6.5). These clusters seem to be contrasted with a significant number of data points which are scattered along the x-axis, possessing much higher emissions than those in the cluster.
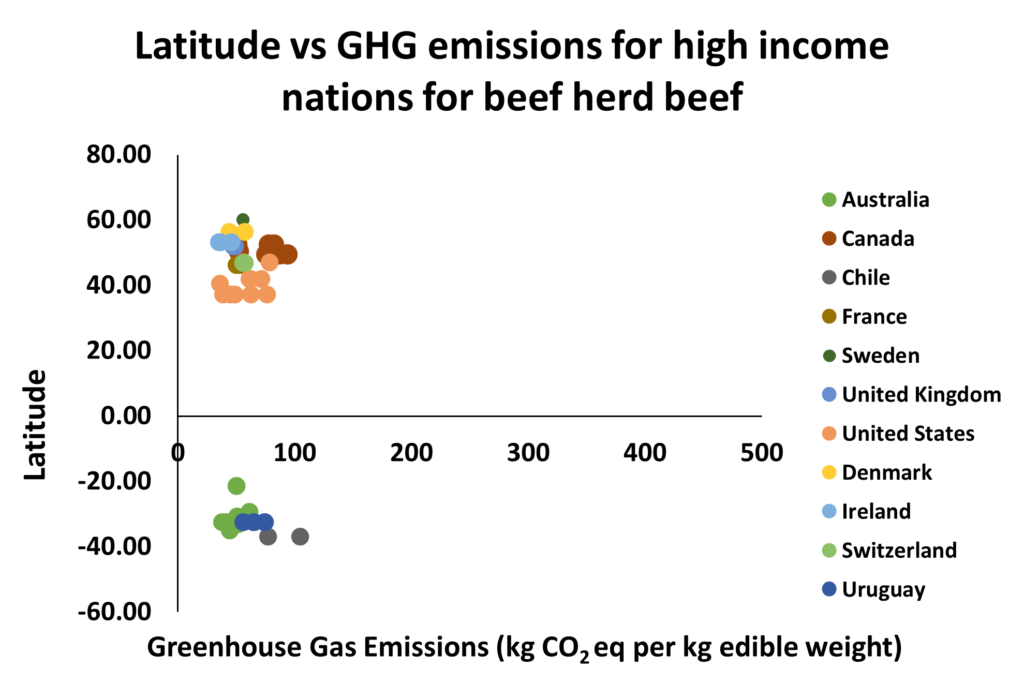
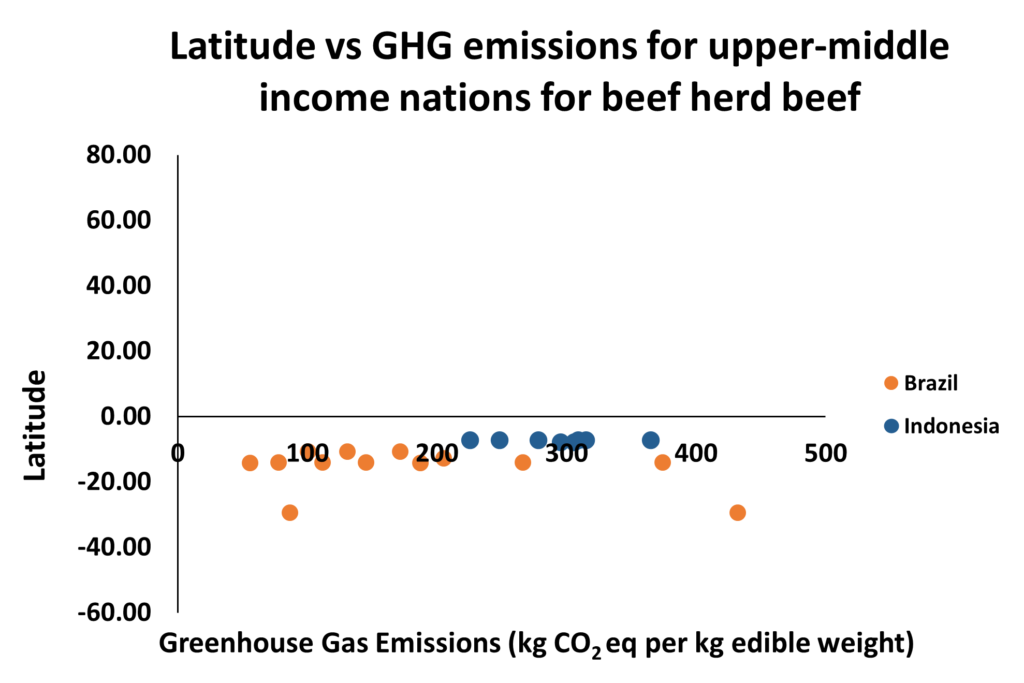
Figure 6.6. Latitude plotted against GHG emissions, divided by income and color-coded by country, for beef from beef herd cattle. Data from Poore and Nemecek (2018). Country income levels from the World Bank (2020).
There doesn’t seem to be a discernible relationship between latitude and emissions, but when these data points are filtered by country, far clearer trends emerge. The surveyed European nations, the United States, Canada, and Australia seem to be the source of the aforementioned “clusters” of countries with similar latitudes, but relatively low emissions (Figure 6.6, left). Brazil and Indonesia seem to be responsible for the erratic data points with relatively high emissions (Figure 6.6, right). Based on this data, beef produced in Brazil and Indonesia produce significantly more greenhouse gas emissions per kilogram than beef produced in other countries. Perhaps production systems in less-efficient nations could be improved by using techniques from more-efficient nations. Not just to mitigate their impact on the global climate, but also to reduce the local environmental impacts tied to heightened greenhouse gas emissions. Notably, Brazil and Indonesia are the only two surveyed upper-middle income countries, contrasted with the clustered and lower-emitting nations, which are all considered high income by the World Bank. The higher amount of greenhouse gas emissions for beef cattle in Indonesia is likely due to the extremely extensive nature of their beef agriculture. In Indonesia, generally one to two heads of cattle are kept per small farm. We hypothesised that this, combined with the longer lifespans of cattle in Indonesia, are part of the significantly increased GHG emissions per kilogram of beef product. But our team doubted that this was the only explanation for the nearly quadrupled GHG emissions per kilogram of beef (Figure 6.6), so we investigated other sources.
Extreme Difference in Change in Land Use Change by Income Level
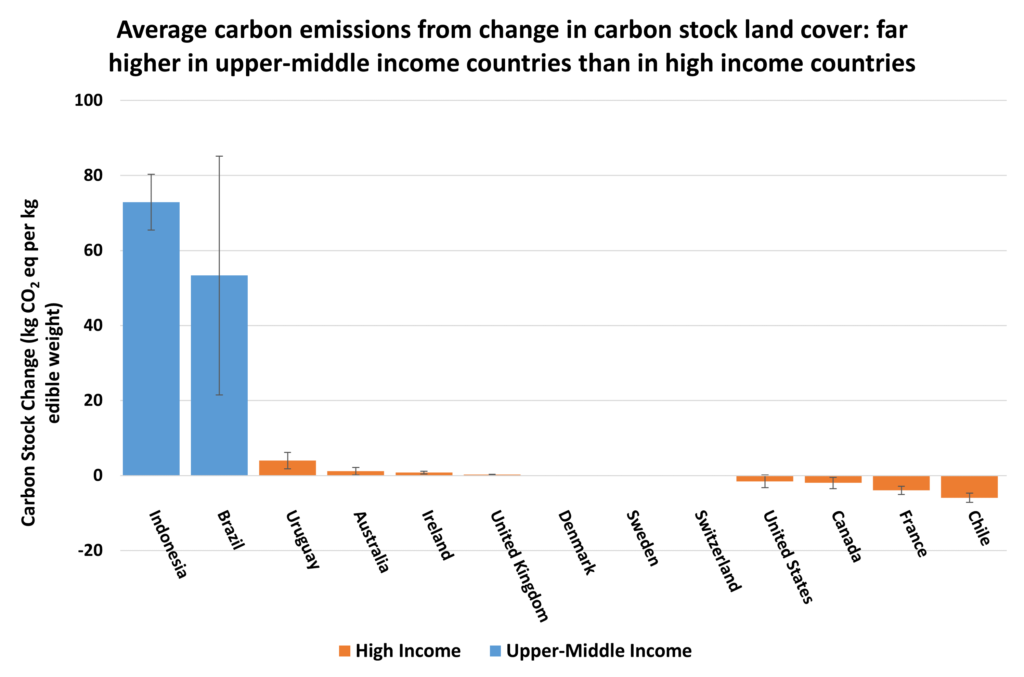
To further investigate this disparity in GHG emissions, the AgImpacts team examined differences among the carbon emissions from land use change in the surveyed nations (Figure 6.8). This metric represents the loss in stored carbon, which consists of above ground, leaf litter, and below ground carbon sinks. The metric is negative for many data points, because the planting of fields can result in an increase in carbon storage. A high level of stored carbon loss implies that land which was formerly covered in carbon-capturing vegetation was replaced by an empty pasture or facility for beef production, releasing the formerly stored carbon. Beef produced in Brazil and Indonesia is connected to extremely high loss in stored carbon compared to beef from high income nations (Figure 6.8). This reveals a greater cost to Brazil and Indonesia’s beef production, there is not just emission of polluting compounds, but also active replacement of vegetated areas. However, the difference in GHG emissions from land-use change alone does not entirely explain the disparity between upper-middle income and high income countries, so more investigation was warranted.
Figure 6.8. Change in carbon stock land cover for beef herd cattle. Each bar represents an average of available data points for the given country, where the error bars indicate one standard deviation of each set of country data. Data from Poore and Nemecek (2018). Country income levels from the World Bank (2020).
Trade-offs Between Enteric Methane Emissions and Cattle Feed GHG Emissions
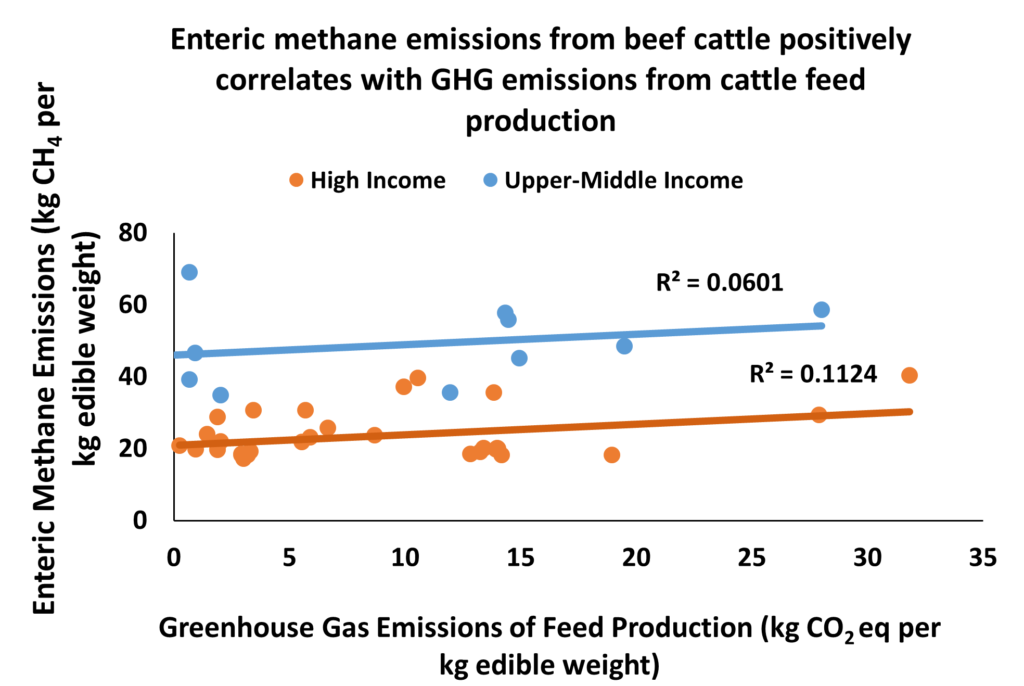
Our team was curious to investigate any potential trade-offs between the GHG emissions produced by the feed for non-grass fed cattle and the resulting methane produced by the cattle through enteric fermentation. When we examined the data, a very similar, slightly positive trend emerged for both high income and upper-middle income nations (Figure 6.7). This implies that more efficient feeds, which reduce the methane produced by cattle through enteric fermentation, are not associated with increased carbon costs in their production. This analysis also provides more explanation for the vast difference in carbon emissions from beef production among the surveyed high and upper-middle income countries (Figure 6.6). It seems that a significant portion of this disparity is enteric methane emissions, which are connected to poor feed quality and feeding from pasture.
Summary
Poor feed quality, extensive systems, and release of land cover carbon stock seem to be the primary difference between systems in more and less efficient beef-producing countries. In order to minimize the environmental impacts of beef production, it would be best to help farmers in these less-efficient countries gain access to better feed, and potentially encouraging intensive farming practices without threatening the livelihoods of farmers who depend on their cattle.

