Overview
Poultry meat, which includes chickens, ducks, turkey, and geese, is the second most widely eaten meat in the world. It accounts for about 28% of meat production worldwide, and it is projected that by 2050, 2.3 times as much poultry meat will be consumed than in 2010. In order to keep up with increasing demand, farms must become more efficient and increase yield. As this push to meet demand spikes, it is crucial that farms follow practices that reduce waste and mitigate environmental harm. This section will cover the trends found among the five environmental indicators and investigate whether the intensity or specifications earned by a farm have an effect on such trends. In this section, there are two defined farm specifications: organic means the animals were given feed without synthetic pesticides, antibiotics, hormones, and mammalian byproducts, and were given access to the outdoors; Label Rouge is a French quality assurance seal, which prioritizes animal welfare and the quality of the product and requires the animals to have been raised free-range. Farm systems are also classified as extensive or intensive. The key difference between these two types is the animal’s access to the outdoors. Extensive systems allow for animals to graze, while intensive systems contain the animals and bring feed to them. Generally, extensive systems are found in small to medium sized farms, while intensive systems are large, automated farms.
Analysis Methods
The entries for poultry meat were taken from the Poore and Nemecek (2018) dataset, which consisted of 4 entries from 13 countries. Because this spreadsheet is a compilation of other data, not all of the entries have a value for each environmental indicator investigated. When this occurred, the entry was omitted from that specific analysis. Additionally, one outlier present in the Poore and Nemecek dataset was omitted from this analysis. The data point represents foie gras, a type of poultry meat that requires excessive feed and resources due to how it is typically farmed. Foie gras depends on fattening up the liver of geese and ducks; the animals are force fed, causing the notable increase in each environmental indicator, and skewing the intervals on each graph. As this outlier is constant throughout all graphs, it was removed to allow for easier data visualization.
GHG and Key Environmental Indicators
We found little correlation between freshwater withdrawal and GHG emissions intensity, although the lowest emitters tended to be among the lowest users of freshwater (Figure 7.1, left). In addition, it appears that chickens and ducks are less impactful in terms of both indicators, while turkeys seem to require more freshwater per the same amount of emissions as chicken.
There are a few concerning points with near-average GHG emissions, but very high freshwater withdrawal (>3,500 L). When the data is sorted by the type of poultry being farmed, as Figure 7.1 is, it becomes apparent that this cluster of concerning points are mostly turkey. The four turkey data points come from the same study within the United Kingdom, which is actually based on structural models of the industry, process models, and simulation models to provide the data.*
From that study’s methodology, it is not entirely clear why there is such high freshwater withdrawal for these points; it could just be due to the mathematical models used by the authors.
The two chicken data points with unusually high freshwater withdrawal have similar reasoning; the right-most data point comes from a sister study of the one responsible for the turkey data points, and therefore has similar reasoning for such high freshwater withdrawal.** The left-most chicken data point with high withdrawal comes from a French farm that took into account water used as both drinking water for the animals, and water for cleaning the equipment and buildings and cooling systems. *** This is atypical for the other LCA’s used in this analysis; most accounted for irrigation and drinking, but not the water associated with cleaning equipment. This suggests that the other studies may have concerningly underestimated the freshwater withdrawal associated with their systems. that these studies may have concerningly underestimated the freshwater withdrawal actually associated with their systems.
* Leinonen, I., Williams, A. G., & Kyriazakis, I. (2016). Comparing the environmental impacts of UK turkey production systems using analytical error propagation in uncertainty analysis. Journal of Cleaner Production, 112, 141–148. https://doi.org/10.1016/j.jclepro.2015.06.024
** Leinonen, I., Williams, A.G., Wiseman, J., Guy, J., Kyriazakis, I. (2012a). Predicting the environmental impacts of chicken systems in the United Kingdom through a life cycle assessment: Broiler production systems. Poultry Science 91, 8-25. https://doi.org/10.3382/ps.2011-01634
*** Koch P. and Salou T. 2015. AGRIBALYSE® : Rapport Méthodologique – Version 1.2. March 2015. Ed ADEME. Angers. France. 385 p.
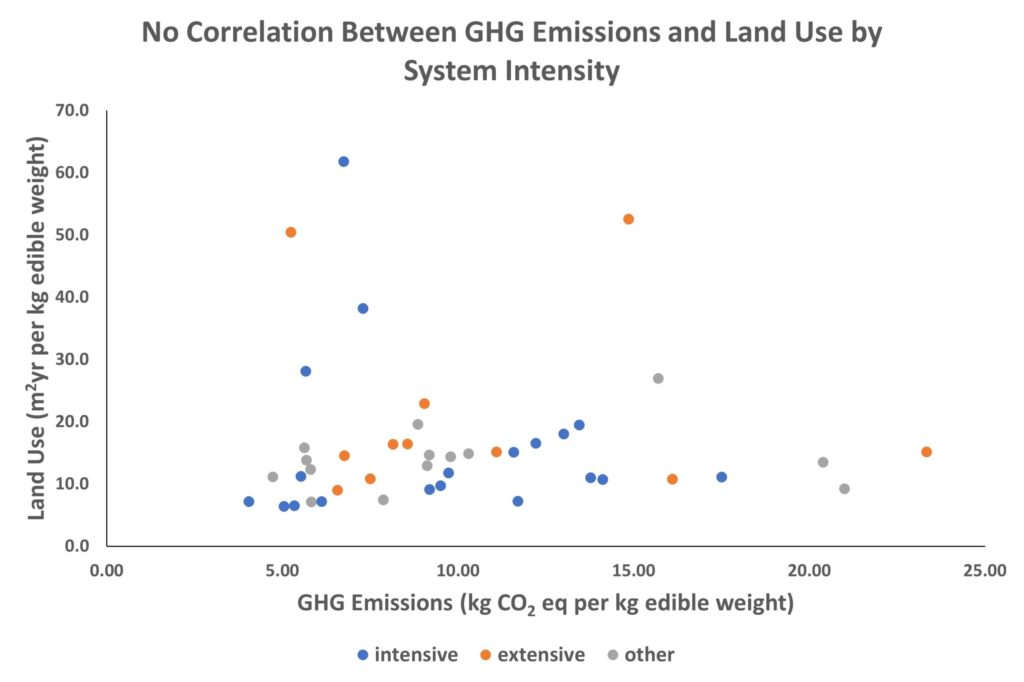
Figure 7.2 (right) is coded by the intensity of the system. This does not seem to be a predictor of higher GHG emissions or higher land use.
A few points stick out as having unusually high land use (>50 m2yr). The two left-most points (one is extensive, the other is intensive) come from the same study.
Focusing on South Australia, it assessed land use by aggregating impacts throughout the supply chain, which meant that both total land occupation and arable land occupation were reported. * Within South Australia, crop yields are lower, which means arable land use increases and thus the total land use reported is consequently higher.
The right-most data point with land use >50 m2yr summarizes the organic system from a UK study; this organic system had higher feed consumption and a higher land area requirement for the production of organic crops when compared with conventional systems, increasing the relative land use.**
* Wiedemann, S. G., McGahan, E. J., & Murphy, C. M. (2017). Resource use and environmental impacts from Australian chicken meat production. Journal of Cleaner Production, 140, 675-684.
** Leinonen, I., Williams, A.G., Wiseman, J., Guy, J., Kyriazakis, I. (2012a). Predicting the environmental impacts of chicken systems in the United Kingdom through a life cycle assessment: Broiler production systems. Poultry Science 91, 8-25. https://doi.org/10.3382/ps.2011-01634
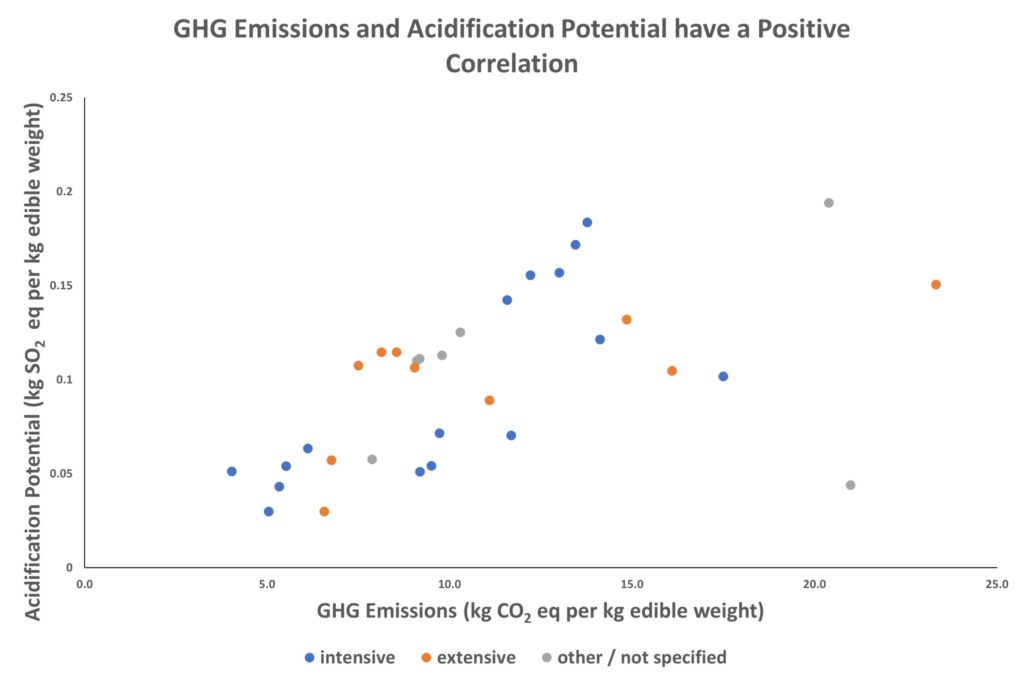
The relationship between GHG emissions and acidification potential is direct. It is also independent of the intensity of the system, suggesting that this correlation is not just due to the farm, and may have causes in other production steps.
Reviewing the data broken down into each production step, the most consequential outside of the farm is the feed (Figure 7.4, below).
The other stages of production, like processing, transit, packaging, and retail, do not have as pronounced of an effect on acidification potential as the feed and the farm.
The acidification potential from the farm stage is likely due to waste produced by the animals. For example, spreading manure on fields can cause volatilization of ammonia and nitrous oxide, leading to soil and water acidification. Additionally, ammonia emissions can result from manure storage and animal housing, causing the increased acidification potential. In the feed stage of production, the high acidification potential is likely due to the usage of nitrogen-based fertilizers to cultivate the crops.
The outlier with transport contributing an abnormal amount to the acidification potential had its product transported from Brazil to the UK, explaining the skewed data.*
* Williams, A. G., Pell, E., Webb, J., Tribe, E., Evans, D., Moorhouse, E., Watkiss, P. (2008). Final Report for Defra Project FO0103, Comparative Life Cycle Assessment of Food Commodities Procured for UK Consumption through a Diversity of Supply Chains. UK.
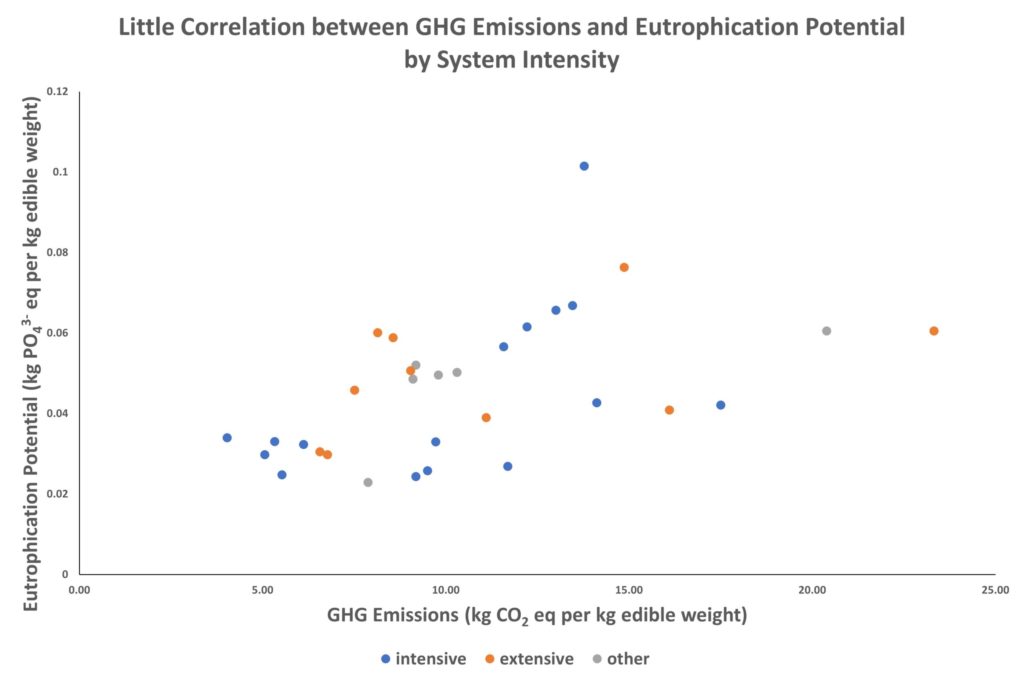
Having high GHG emissions does not correlate with high or low eutrophication potential, and no trends emerge when this data is coded by farm specifications or poultry type.
The outlier data point, with eutrophication potential >0.08 kg (PO4)3- eq, comes from Brazil.* Within the LCA in the study, it is evaluated that 99% of the eutrophication potential comes from “transport to the UK,” explaining the high value.
* Williams, A. G., Pell, E., Webb, J., Tribe, E., Evans, D., Moorhouse, E., Watkiss, P. (2008). Final Report for Defra Project FO0103, Comparative Life Cycle Assessment of Food Commodities Procured for UK Consumption through a Diversity of Supply Chains. UK.
Other Trends
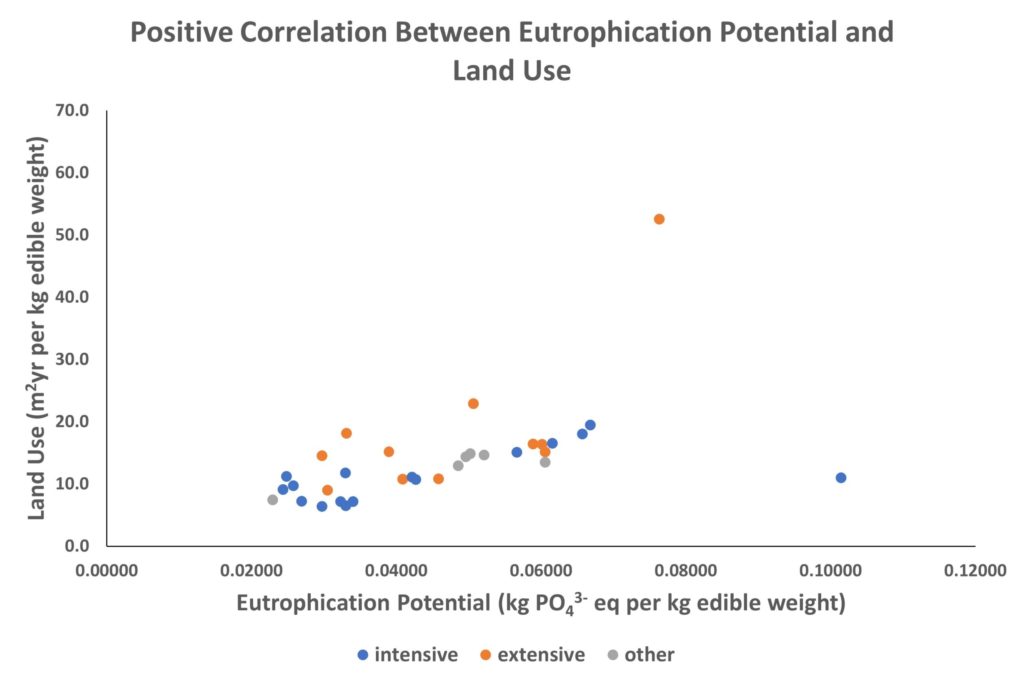
Solely comparing GHG emissions with the other four indicators does not provide an entire picture of the relationships among the poultry commodity. The environmental indicators have relationships amongst each other, outside of GHG emissions. As shown in Figure 7.6 below, there is a clear, positive relationship between eutrophication potential and land use in both intensive and extensive systems.
There is a clear, positive relationship between eutrophication potential and land use in both intensive and extensive systems.
This direct relationship is likely due to the fact that life-cycle assessments include the feed stage in production. Land use includes arable land used to produce the feed for poultry, and eutrophication potential can come from artificial fertilizers used to increase yields. It follows that as the arable land used to make feed increases, so would the amount of artificial fertilizer used on that land, contributing to this direct relationship.
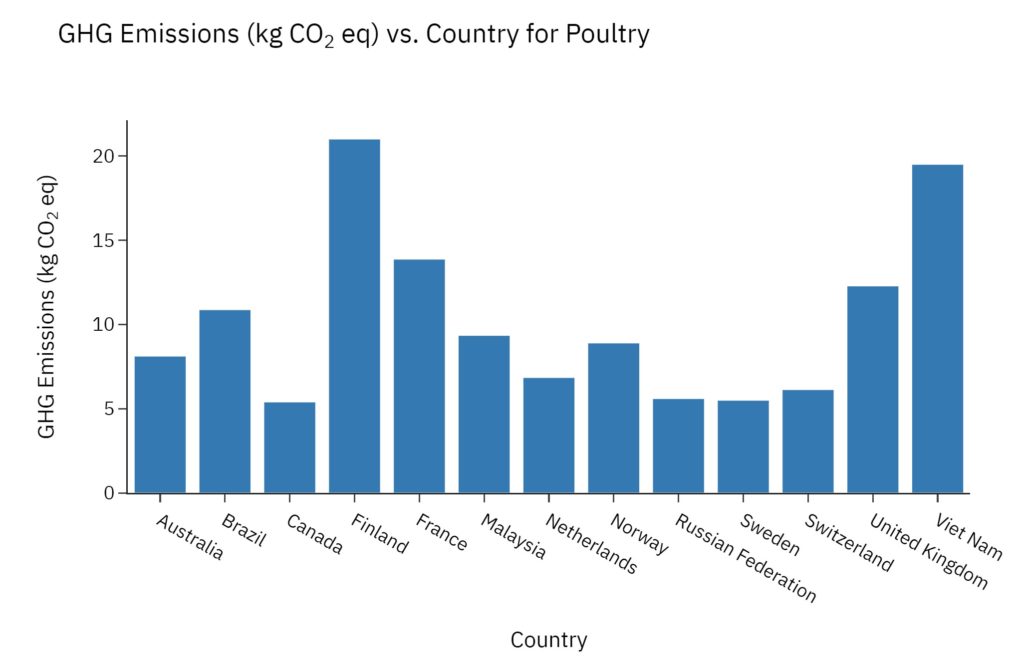
When comparing GHG emissions to country of origin, two countries top the chart by a considerable amount: Vietnam and Finland.
The issue of GHG emissions from Vietnam is highly documented, as Vietnam ranks among the 20 countries with the highest GHG emissions in the UNFCCC and FAOSTAT databases. Half of all livestock emissions are due to manure management, and the other half is due to emissions from enteric digestion.*
The high GHG emissions from Finland are not as easily explained. The outlying number is reported from one data point. It is likely that this study is an anomaly, since comparable farms in the Nordic countries have much lower GHG emissions, but more research is needed to determine why the emissions were reported to be so high.**
* Truong, A. H., Kim, M. T., Nguyen, T. T., Nguyen, N. T., & Nguyen Q. T. (2018). Methane, Nitrous Oxide and Ammonia Emissions from Livestock Farming in the Red River Delta, Vietnam: An Inventory and Projection for 2000–2030. Sustainability 10(10):3826. https://doi.org/10.3390/su10103826
** Katajajuuri, J-M., Grönroos, J., Usva, K., Virtanen, Y., Sipilä, I., Venäläinen, E., Kurppa, S., Tanskanen, R., Mattila, T., & Virtanen. H. (2006). Broilerin fileesuikaleiden tuotannon ympäristövaikutukset ja kehittämismahdollisuudet. Maa-ja elintarviketalous. 90, 1-118.
Summary and Next Steps
Within the poultry commodity, there seem to be no trade-offs between GHG emissions and the four key environmental indicators: land use, freshwater withdrawal, eutrophication potential, and acidification potential. No correlation was found between GHG emissions and land use, freshwater withdrawal, or eutrophication potential. However, there is a direct relationship between acidification potential and GHG emissions, which likely comes from the feed stage in production. As this is a direct relationship, there is a co-benefit between GHG emissions and acidification potential: if one of these indicators is decreased, the other follows.
No notable trends were found when this data was organized by the specifications earned by a farm, which is why those corresponding graphs weren’t shown. This is in large part due to the fact that there were not enough data points of each type to be able to draw reasonable conclusions. Expanding this data set to include these farm types would allow an exploration of the trade-offs between different specifications earned by a farm. It could even reveal trade-offs between animal welfare, or the quality of product, with environmental factors.
Room for expansion within this project includes expanding the dataset to include more non-chicken entries to provide crucial insight. In Southeast Asia, the traditional rice-fish/rice-duck (RF/RD) farming systems use less chemical fertilizers and pesticides and promote sustainable use of the limited arable land available. Inclusion of this data would provide interesting comparisons with the current dataset. Analyzing different systems to understand their unique trade-offs is especially important because the poultry industry must become more efficient to meet demand by 2050, and such an investigation would look into polyculture as a potential way to increase yield and land efficiency.


