Overview
Soybeans have become a staple crop due the crop’s diverse range of uses, including for human and livestock consumption. Of the millions of metric tonnes of soybeans produced annually, upwards of 85% goes to livestock feed while the remainder consists of soybean oil and products specific for human consumption (tofu, soymilk, etc.). The demand for the crop is only projected to grow in the coming decades as animal protein consumption increases. If current trends continue, the growth of soybean production will come at the cost of increased land and agrochemical usage. Increased land usage is a particularly threatening issue as local ecosystems are often destroyed; this also dramatically increases global greenhouse gas emissions. Soy is a major driver of agricultural expansion in various regions, seen especially in the Amazon. For the last two decades, the Amazonian Basin has seen the fastest growth of arable land and also has the most available area to be converted to farmland.
Given that soy is one of the most commonly grown crops, it is critical that the coming years feature improved systems by which soybeans can be grown, processed, and transported.
Methodology
We investigate the environmental effects of the soybean life cycle ranging from the inputs (fertilizers, soil, etc.) to the start of product processing, analyzing specifically farms producing raw soybeans or soybean oil as a retail product. All emissions released and land or water used to process and transport raw soybeans were not included in the values for this paper’s analysis, to appropriately capture soybeans destined for animal feed. The data used for this commodity has also been derived from the Poore and Nemecek (2018) data set and consists of 8 soybean oil and 41 soybean data points from the following 10 countries: Argentina, Brazil, Canada, China, India, (the Islamic Republic of) Iran, South Africa, Switzerland, Thailand, and the United States of America. The species of soybean, Glycine max (L.) Merr., is consistent across all farms. Analysis of certain indicators included fewer data points as the farms were not documented equally– acidification potential and eutrophication potential have 44 and 28 data points respectively.
Poore and Nemecek’s data measured the effects of soybean oil emissions per liter of soybean oil. However, in order to standardize all of the data points, the values for soybean oil farms were adjusted to a kilogram of unprocessed soybeans. We used the generic density of soybean oil – 0.93 kg/L, found in the Poore and Nemecek data sheet – to convert the indicators to be in terms of kg soybean oil, and then multiplied by 0.18 to convert from kg soybean oil to kg soybean (Figure 3.1). 18% is a commonly accepted value for the fraction of soybean oil able to be extracted from soybeans by weight, and is consistent with the paper's methodology.
Figure 3.1. The equation used to convert values from soybean oil data points from per liter soybean oil to per kg soybean.
Environmental Indicators and GHG Comparison

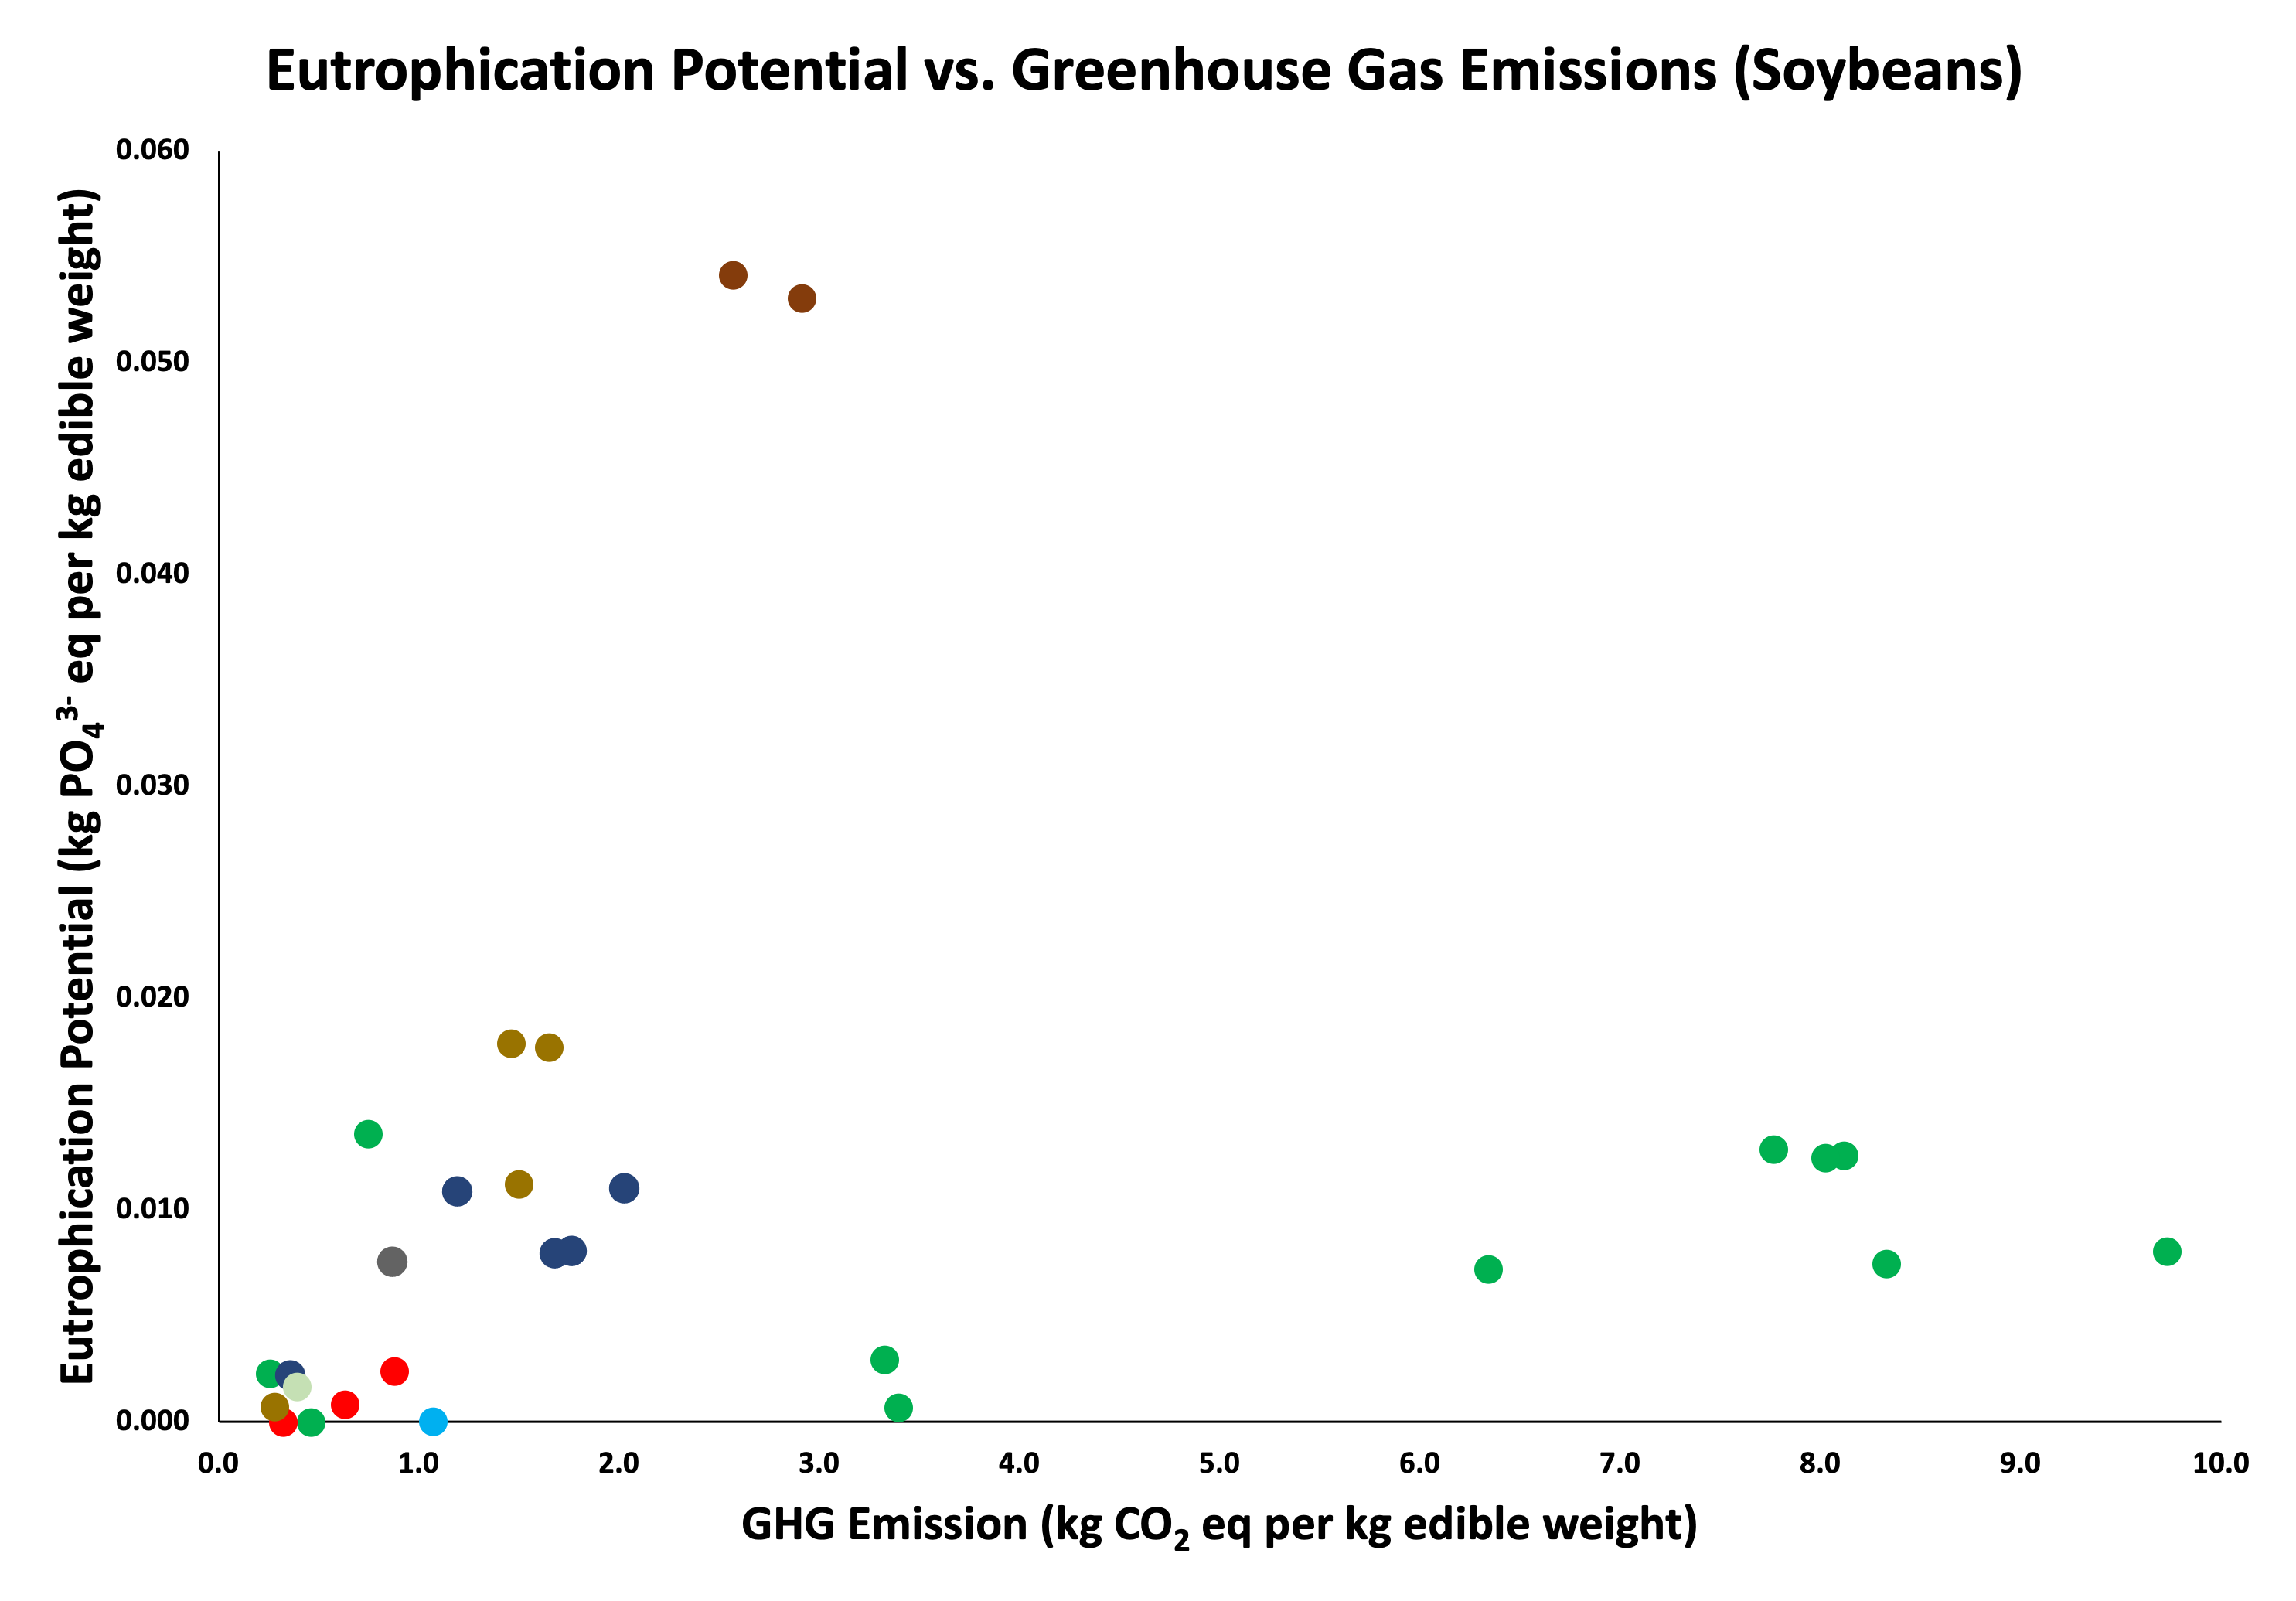
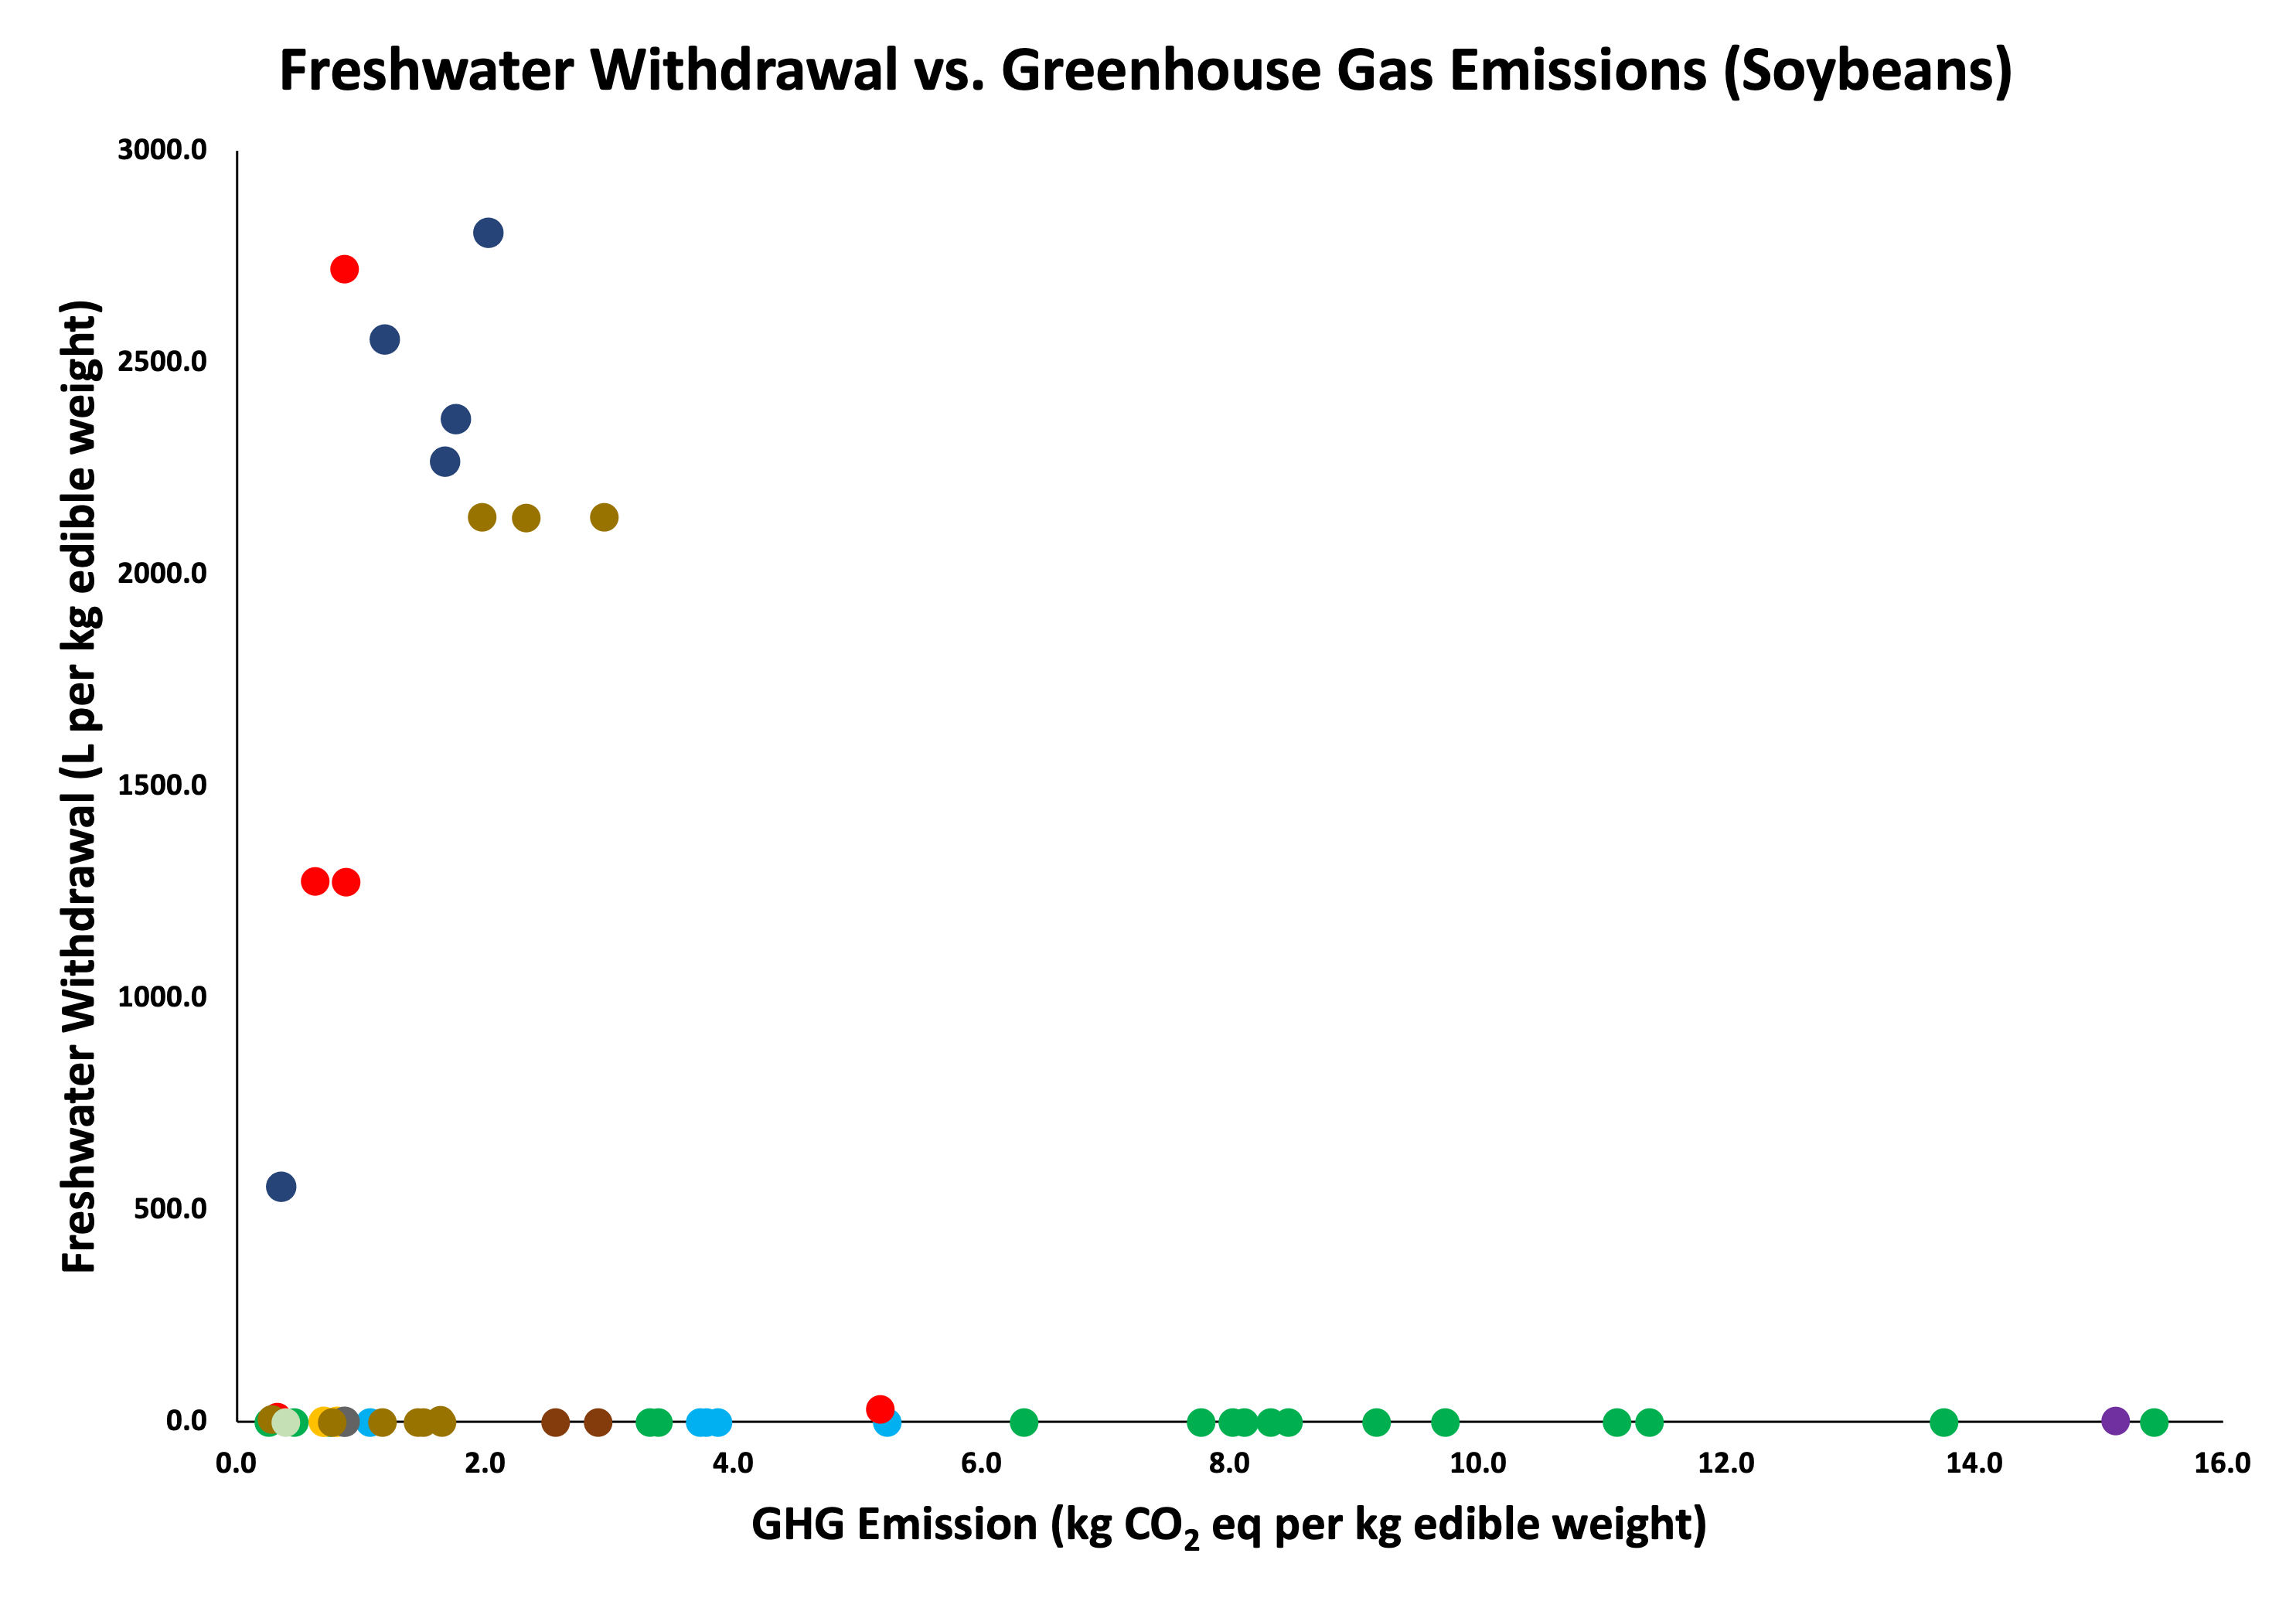
Figure 3.2a, b, c, d. Land use, acidification potential, eutrophication potential, and freshwater withdrawal have no strong correlation to GHG emissions, the strongest being Land Use vs GHG emissions in Brazil. Colors indicate country. Data from Poore and Nemecek (2018).
There is a level of disparity across the graphs due to the aforementioned lack of equal documentation. All 49 samples include data for land use, freshwater withdrawal, and GHG emissions, but graphs including acidification or eutrophication potential contain fewer plot points (Figure 3.2b, c). Note that for freshwater withdrawal, dramatically different systems of water provisioning account for the split between zero and non-zero water use; China, Iran, and parts of the USA use flood application irrigation, while the other data points are rainfed.
We saw no correlations between the four environmental indicators against GHG emissions; this was also true for country-specific data, although some clustering by country does appear, likely driven by similar production methods and/or climate. The strongest trend present between land use and GHG emissions in Brazil (Figure 3.2a); the wide range of emissions from Brazil are driven by land-use change. This trend suggests that the farms on recently converted forest are relatively low-yielding.
The other country clusters may merit further study to identify common drivers or mitigation opportunities. For example, Iran (Figures 3.2a and 3.2c) has high acidification potential, while Switzerland has high eutrophication potential (Figure 3.2a, c). By studying all of these clusters and selectively choosing aspects of the most optimized countries, we may be able to create a system that minimizes all five environmental indicators for all countries without any technological advances. Analyzing the clusters of data points, further research into Iran for minimizing land use, South Africa and the USA for acidification potential, the countries aside from Brazil, India, and Switzerland for eutrophication potential, and South Africa, Thailand, Canada, and the USA for freshwater withdrawal will offer glimpses into the conditions that allow for their low values (Figure 3.2).
Land Use Change
As mentioned previously, land use change poses a major consequence for the future of soybean production. The conversion of forests into farmland is especially damaging to the environment because the process not only releases greenhouse gases into the atmosphere from the tree biomass but also from the soil; habitat for many rare species is also lost.
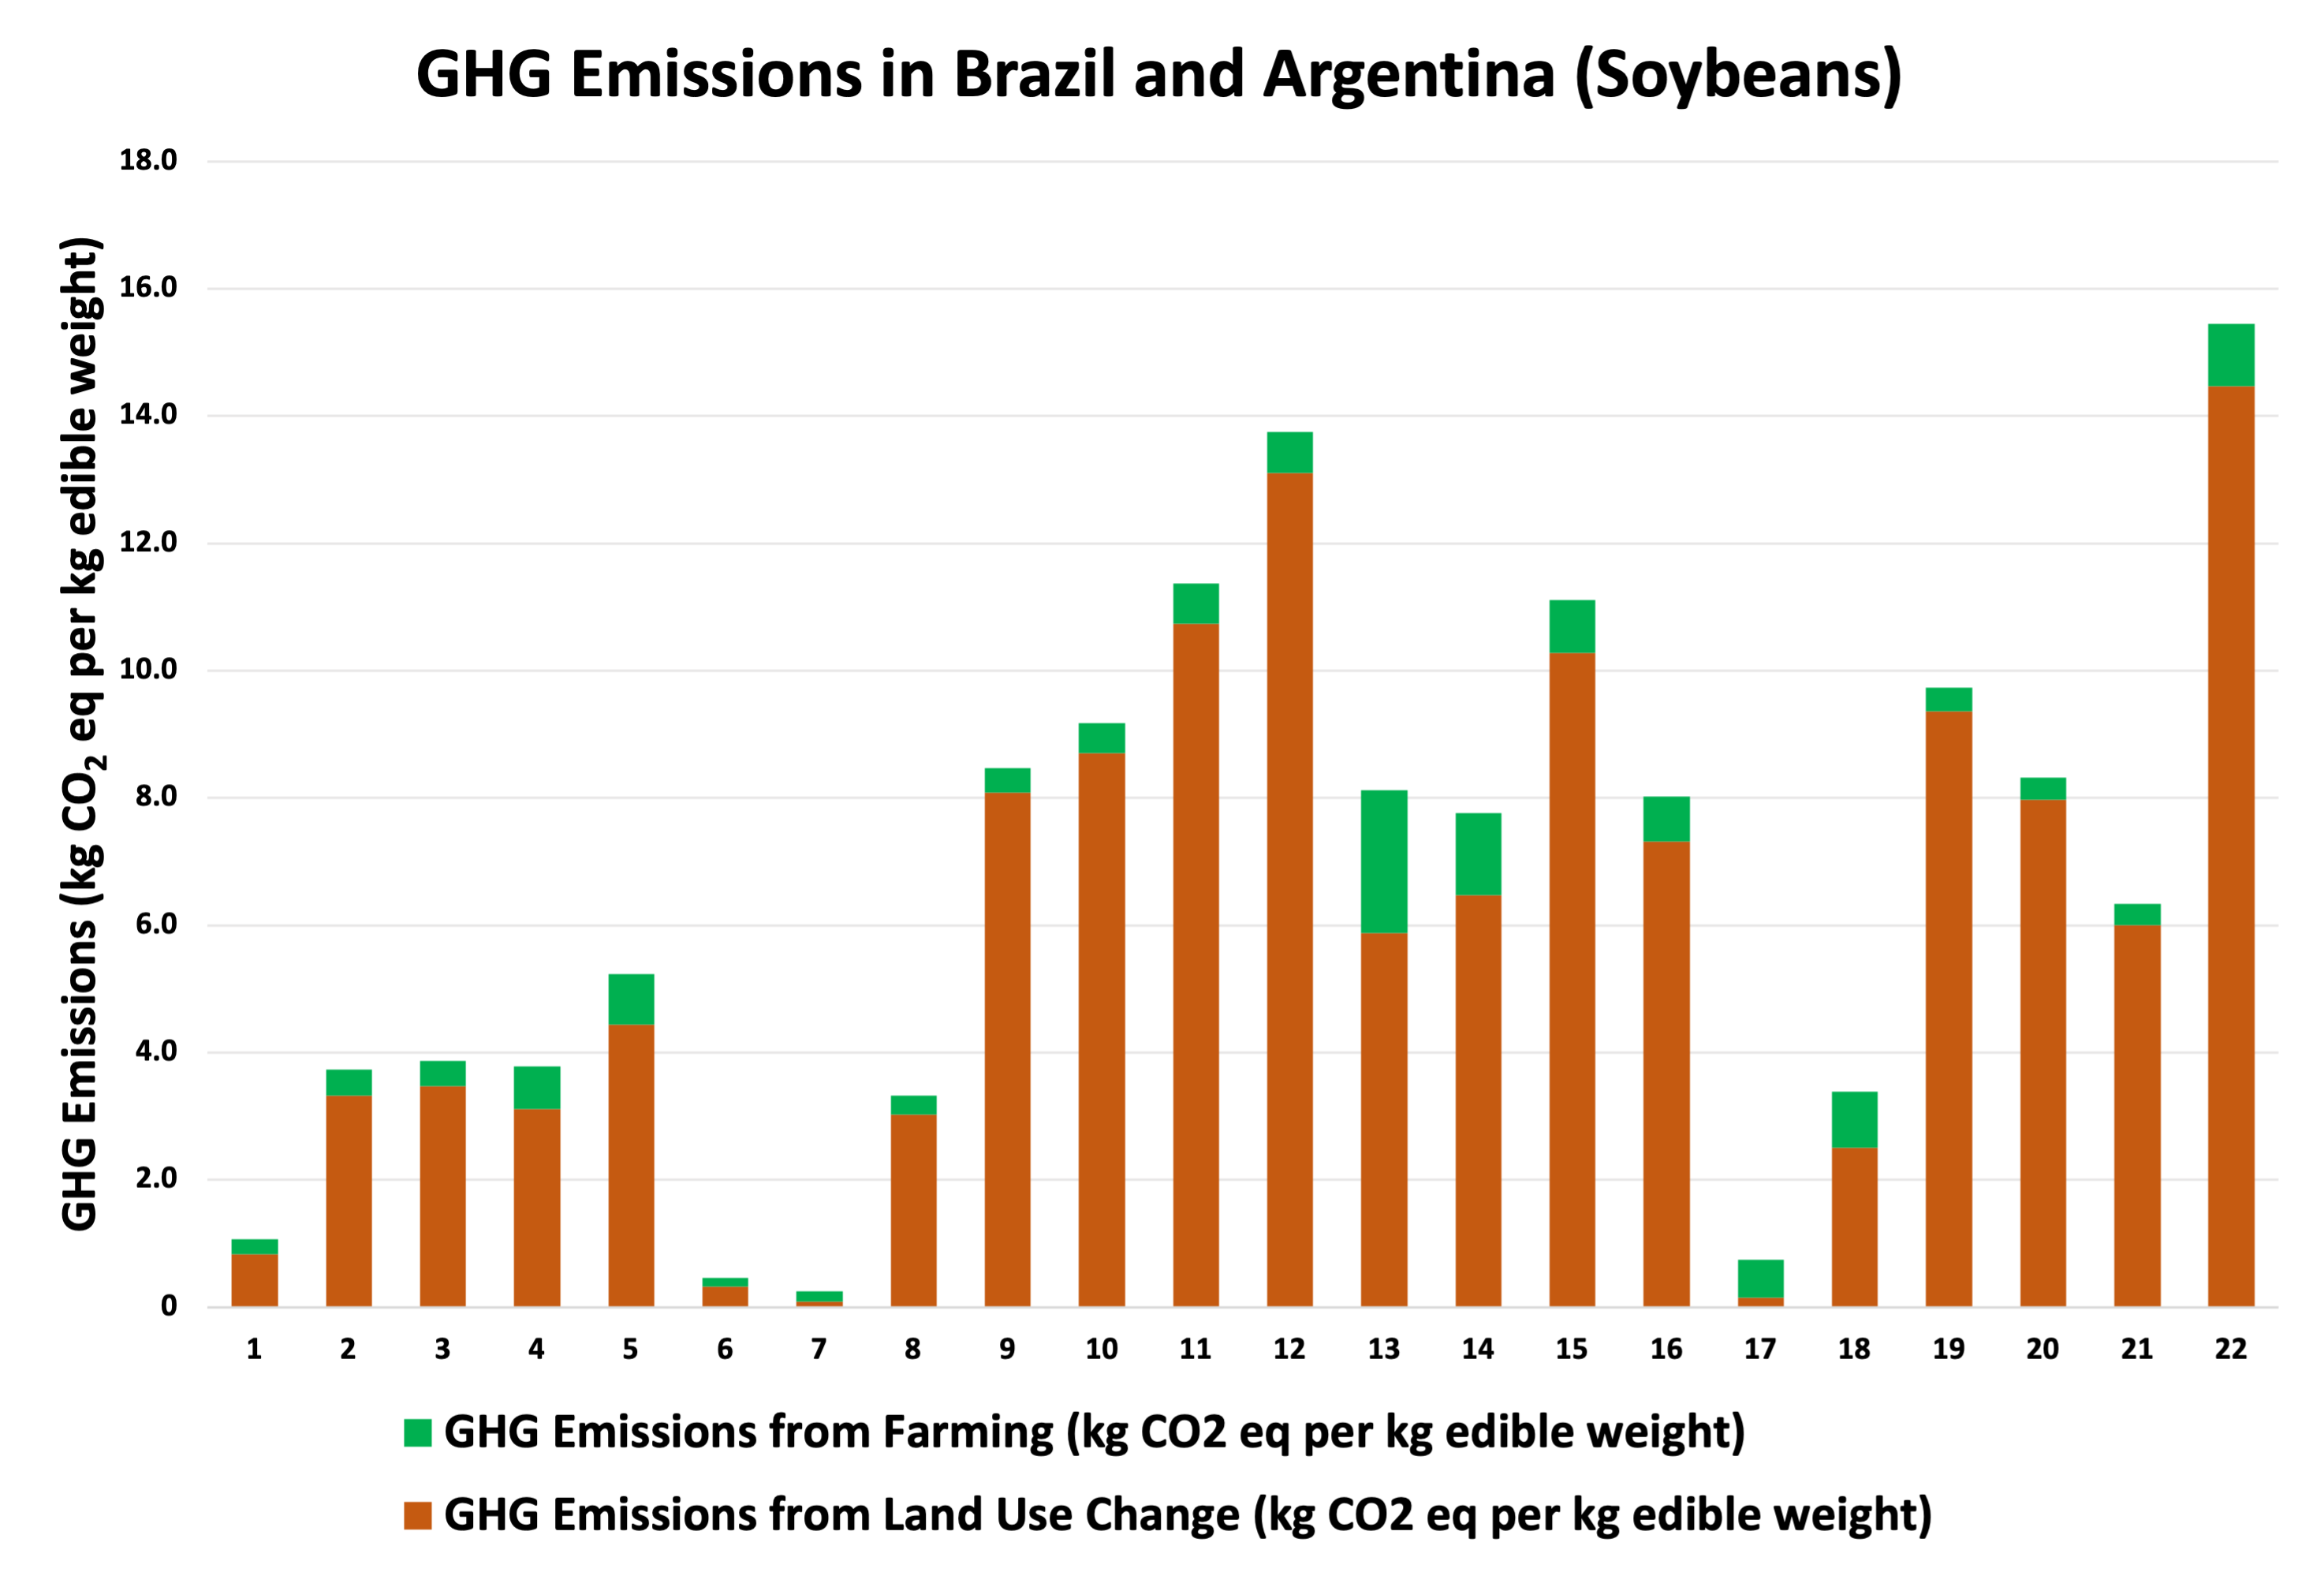
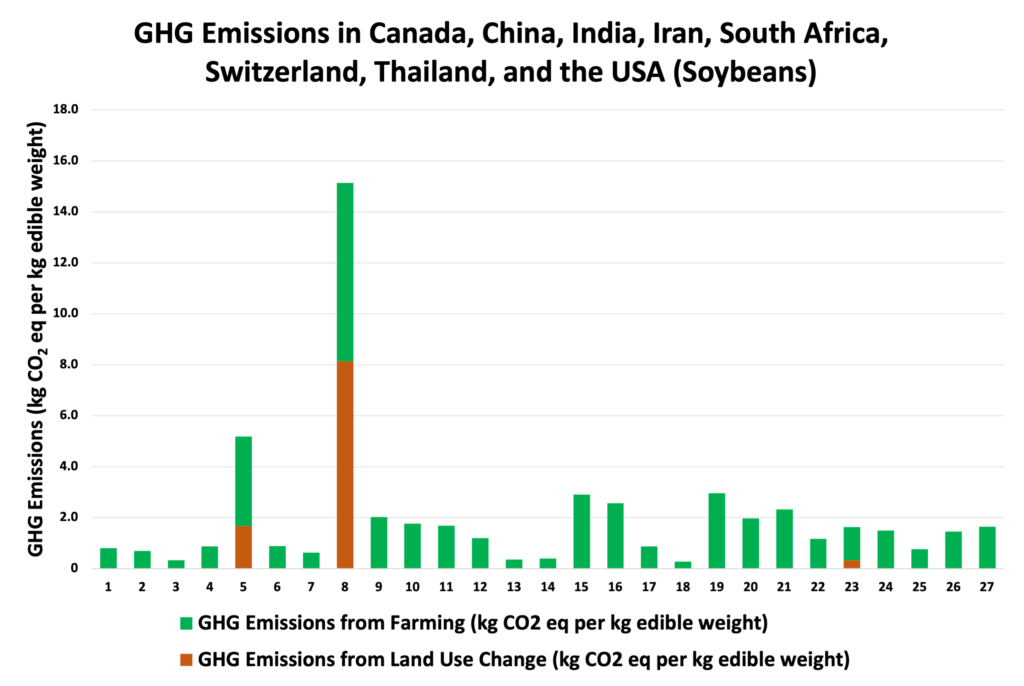
Figure 3.3a showcases the greenhouse gas emissions from Argentina (columns 1-5) and Brazil (6-22). In nearly every point, land use change is overwhelmingly the main source of greenhouse gases, with the only other country from the dataset to somewhat rival this pattern being India (Column 8 of Figure 3.3b). This is extremely significant because not only has the bulk of Latin America’s GHG emissions been identified, it is a feature that can be reduced through legislation and improved practices without disrupting existing soybean farms.
In comparison to Figure 3.3b, the average greenhouse gas emissions from farming in Argentina and Brazil are about a kilogram of CO2 eq less than the average of all of the other countries. This is another possible region to study for potential ways to reduce GHG emissions during the farming stage of a soybean’s life cycle.
The Amazon, where land use change is a prominent issue, acts as a major carbon sink for the planet. It becomes increasingly vital to improve the practices or legislature governing it to protect against the dual consequences of deforestation.
Patterns in Acidification and Eutrophication Potential
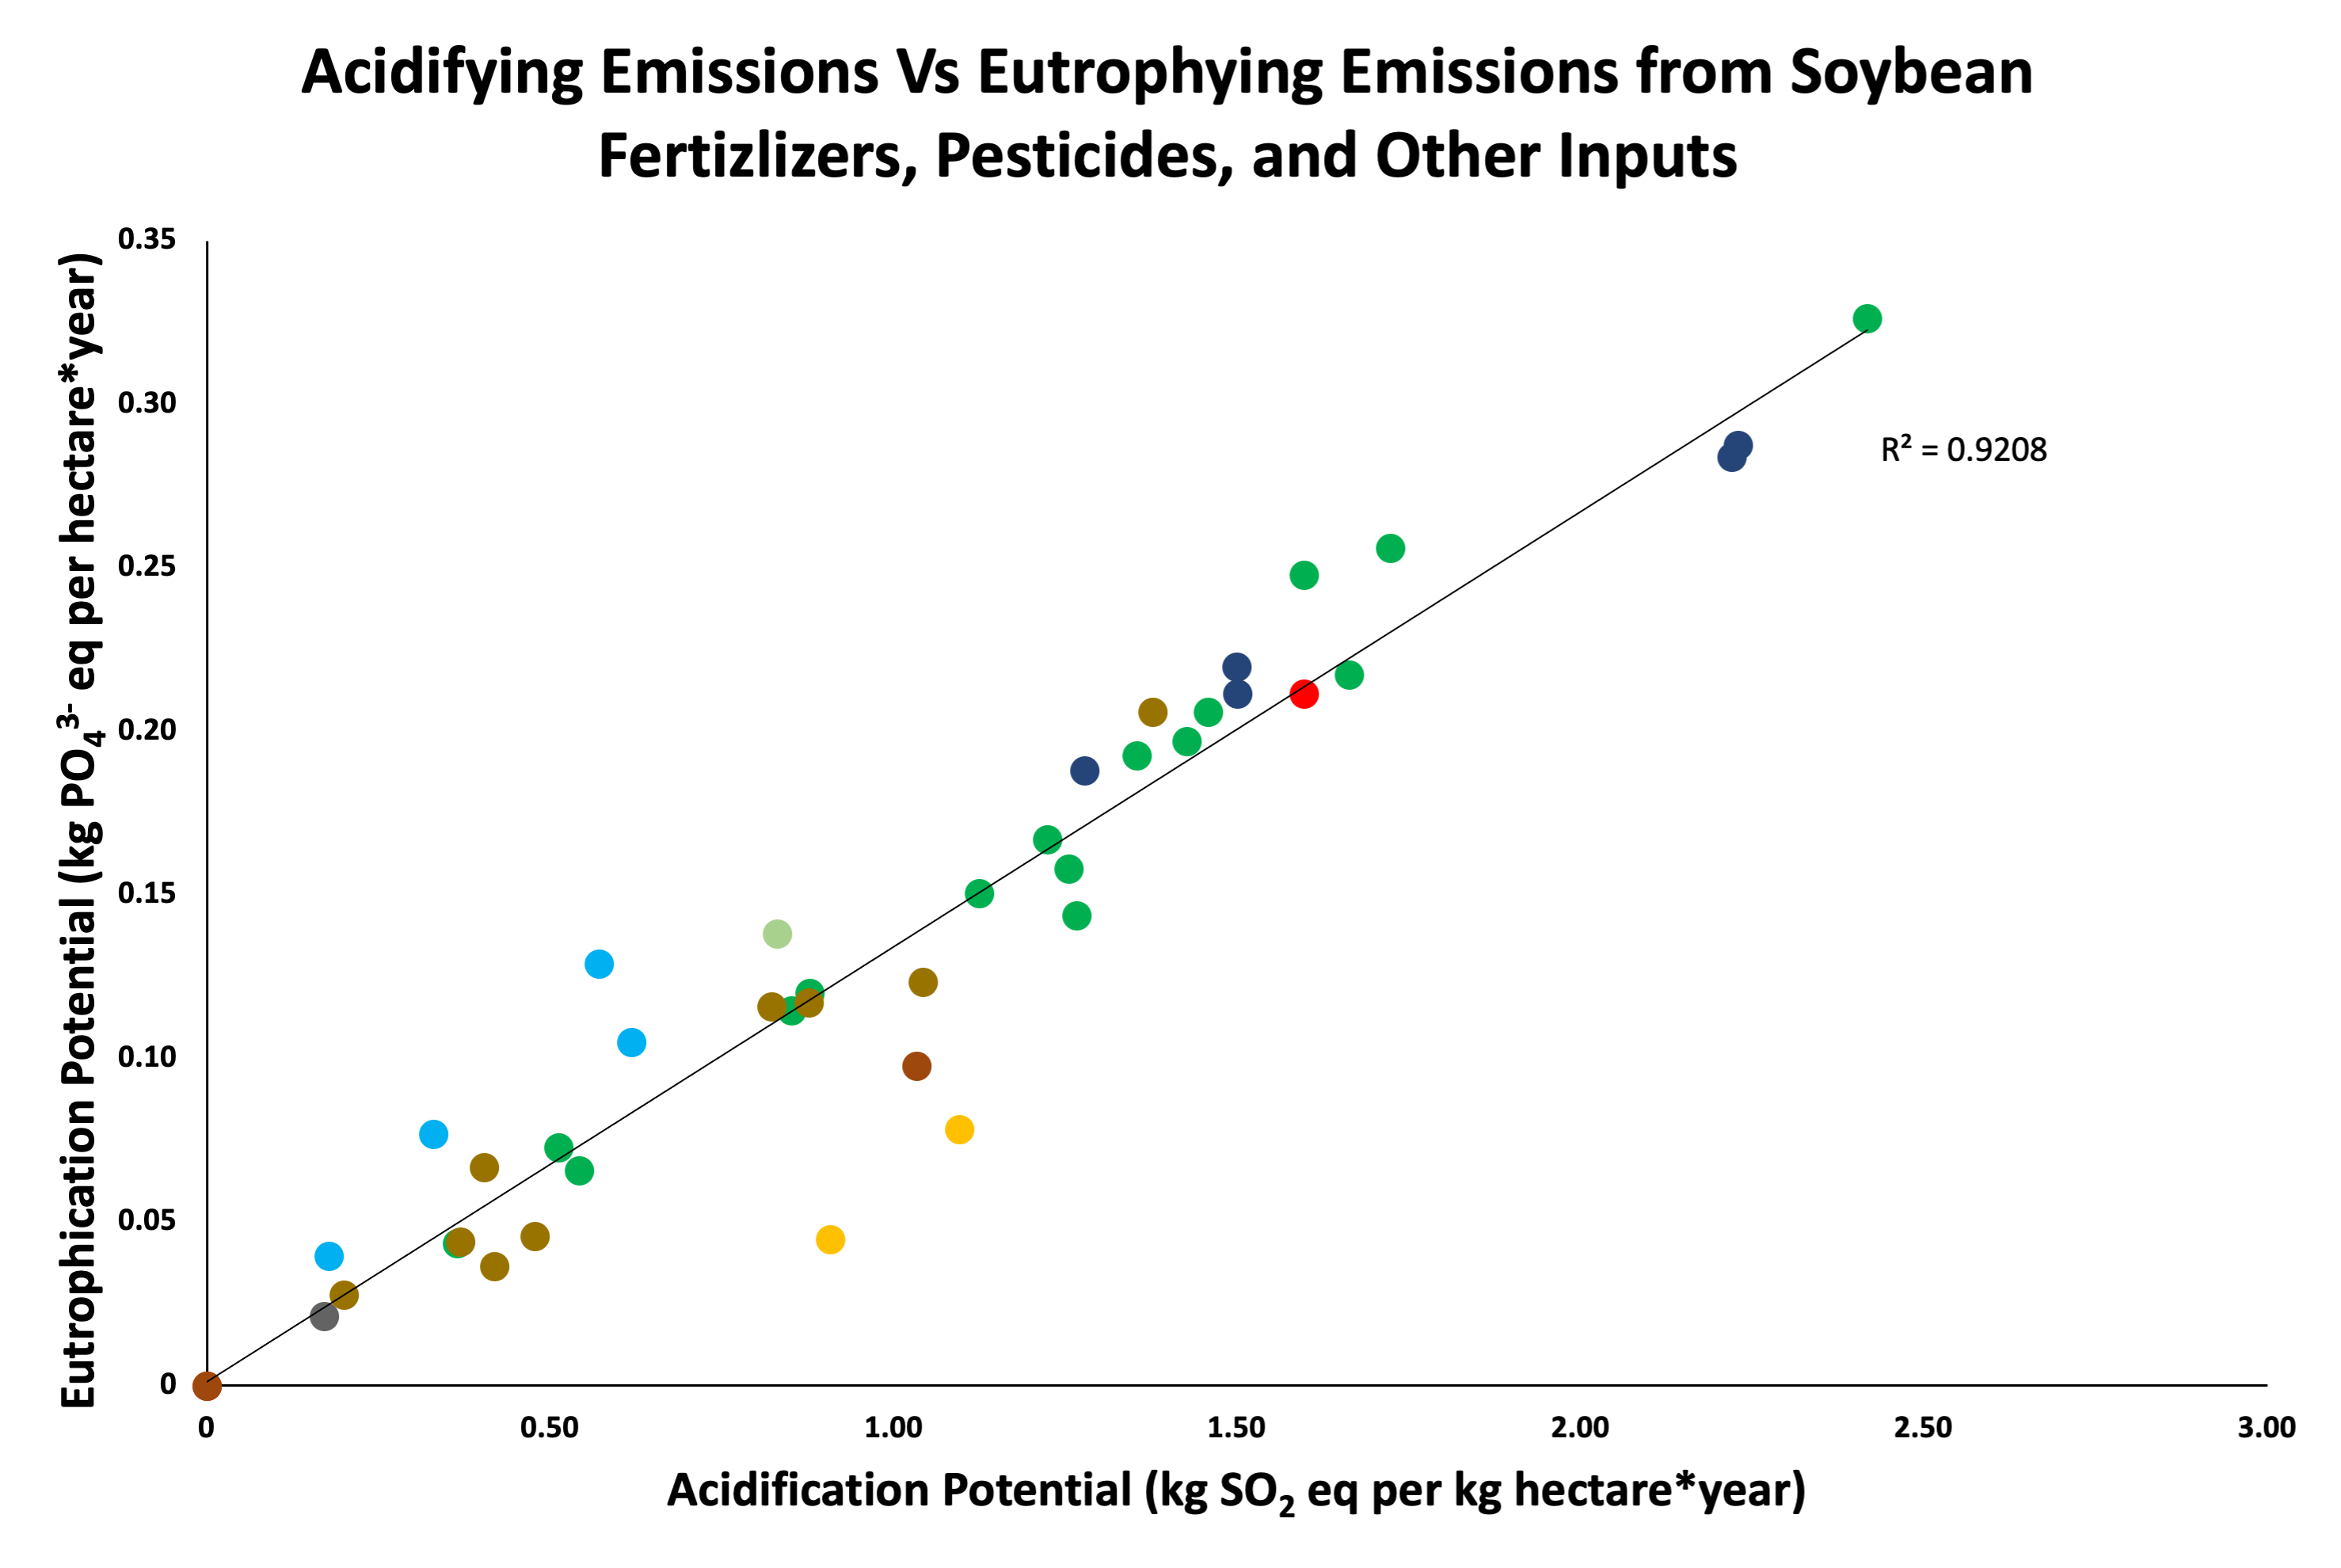
Further analysis of impacts at different production stages may be a promising avenue for future research. For example, We noted that eutrophying and acidifying emissions were loosely correlated overall (Fig 3.4) but tightly correlated in the inputs (fertilizers, pesticides) (Fig. 3.5); because this relationship was not present with land-use, better nutrient management may be a win-win for both the environment and input budgets.
Figure 3.4. Eutrophication Potential plotted against Acidification Potential with varying degrees of correlation. China and Iran demonstrate a low maximum threshold for eutrophication potential across a wide range of acidification potential values while Brazil and the US cluster for lower acidifying emissions but greater eutrophying emissions. Data from Poore and Nemecek (2018).
Moving Forward
Determining the drivers between any pattern requires further assessment of individual farming systems, but in order to understand the acidifying and eutrophying emissions released, future research could target agrochemicals. One of the core components of soybean production in many farms is the necessity of fertilizers, pesticides, and herbicides to help farmers improve crop yields, but often impacts the neighboring environment. Because the emissions were not directly proportional, the data suggests that different agrochemicals, or ratios of, may have led to different ratios of emissions from each country. Research may be able to identify if these distinctions are the result of unnecessary chemical usage or farm conditions that demand such use.
Seeing that not all of the countries follow the same trend and many countries do not show any trends reveals differences in the conditions of farms both regionally and individually within a country. Moving forward, this information could be used to analyze regions or individual farms to better understand the conditions and system that soybeans are grown in there. Other farmers or policy makers may selectively choose for the systems or features of such that allow for the most environmentally sustainable soybean production. Many of the patterns identified in the figures above demonstrated a balance of low values for multiple environmental indicators. Being able to recognize the reasons for these offers the prospect of being able to apply those principles to other farms and improve their ecological viability. Furthermore, having found no inversely proportional relationships is evidence that efforts to mitigate one of environmental indicators does not tend to come at a commensurate increase of another. Future investigation may include the regional or individual conditions of each farm such as latitude, system type (tillage or no tillage), type of agrochemicals involved, etc.
Other potential improvements for global soybean production, as highlighted in the 2014 World Wildlife Fund for Nature’s report, consists of improved policies and legislation (prevention of deforestation) and better use of land, agrochemicals, and water to reduce negative environmental effects. Land use change is the primary contributor of greenhouse gas emissions in Latin America while agrochemicals add to acidifying and eutrophying emissions globally. Furthermore, a large contributor of emissions in the life cycle of soybeans is transportation; faulty or poor infrastructure to move soy may increase emissions from loss as well as from transport. Improvements in transportation networks will help reduce the effects of multiple farms.
Compared to another commonly grown crop, most maize farms paralleled the values found in soybean farms (with a few outliers, such as soybeans grown in Switzerland releasing much more eutrophying emissions). No significant trends for either crop across the environmental indicators and GHG emissions were found. Similar to maize, high land-use values were found in Africa (the one soybean data point documenting South Africa, reports highland usage in comparison to all other countries).
The presented information is not enough to derive any significant conclusions from yet but offers insight into where research may be conducted. This analysis suggests where better and worse practices may be found and points towards interventions that have minimal negative environmental impact.
Summary
Regional analyses must be conducted to understand what differences in farm conditions cause varying degrees of the environmental impacts by indicator. In doing so, policy makers and farmers may adjust their farms to minimize these effects. Furthermore, land use change is a practice that, if properly regulated in Latin America, will greatly reduce greenhouse gas emissions without the need for technological advancements.


